
Tableau is a leading tool for data visualization, but it has a major limitation. It can’t reliably pull live data from websites on its own. The old Web Data Connector (WDC v2) that previously solved this was deprecated in 2023. Its last compatible version (Tableau 2022.4) has since reached end-of-life, leaving analysts without a supported solution.
This guide compares 6 methods for web scraping and connecting live data to Tableau. It also includes a step-by-step tutorial for building an API-to-Tableau pipeline using Bright Data’s Web Scraper API.
TL;DR
Tableau can’t scrape websites natively, and its Web Data Connector (WDC v2) was deprecated in 2023. You need an external data pipeline.
- WDC v2 is deprecated; WDC v3 is extract-only and complex to build
- Google Sheets, Excel, and TabPy each have critical limitations at scale
- DIY Python scripts work initially but require constant maintenance
- A managed scraping API handles proxies, CAPTCHAs, and data parsing automatically
Follow the step-by-step tutorial in this guide to build a working Amazon → Bright Data → Tableau pipeline.
Why Tableau needs an external data pipeline
The modern data stack requires live web data: competitor prices, social media metrics, job postings, real estate listings, and financial feeds. Tableau wasn’t designed to collect it.
The main challenges are:
- Websites change constantly – layouts shift, anti-bot measures evolve, JavaScript rendering requirements increase
- Scale is critical – monitoring 10,000 competitor SKUs daily requires retry logic, rate limiting, and failure handling that a single-page script doesn’t need
- Compliance is mandatory – GDPR, CCPA, and platform terms require careful data collection practices
- Infrastructure is expensive – proxy rotation, CAPTCHA solving, retry logic, and IP management are ongoing engineering challenges
The following methods close that gap.
6 methods for web scraping and connecting live data to Tableau
Each method balances scale, maintenance, and reliability differently. They’re listed from least viable to most production-ready.
Method 1: Tableau Web Data Connector v2 (deprecated)
What it was: WDC v2 let you build JavaScript-based connectors that pulled data from web APIs directly into Tableau.
Why it no longer works: Deprecated in Tableau 2023.1. WDC v2 connectors are unsupported in all current Tableau versions, and Tableau may remove them entirely in a future release. Migration to WDC v3 is required, but v3 is a fundamentally different architecture.
Critical limitation: Support has ended. If you’re still running WDC v2 connectors, migrate now because they could stop working in any future Tableau update.
Method 2: Google Sheets as an intermediate layer
How it works: Scrape data into Google Sheets (via Apps Script, IMPORTXML, IMPORTDATA, or third-party tools), then connect Tableau to Sheets as a live data source.
Why use it: It’s free, requires no coding, and Tableau connects to Google Sheets via its Google Drive connector.
Critical limitations:
- Google Sheets has a 10 million cell limit – large datasets reach this limit quickly
IMPORTXMLandIMPORTHTMLformulas break constantly due to website structure changes- Refresh timing is unreliable. Google throttles formula execution unpredictably
- No JavaScript rendering, so modern single-page applications (SPAs) return empty data (a Scraping Browser is required for these)
- Rate limits on the Google Sheets API cause sync failures during scheduled refreshes
Bottom line: Works for small prototypes. Breaks at any larger scale. Good choice for personal dashboards tracking fewer than 10,000 rows of rarely changing data.
Method 3: Excel + OneDrive / SharePoint
How it works: Use Excel’s Power Query or “Get Data from Web” feature to pull data from URLs and save to OneDrive. Then connect Tableau to the cloud-hosted Excel file.
Critical limitations:
- Manual refresh required – Power Query doesn’t auto-refresh in the background reliably
- No JavaScript rendering, so it can’t handle React, Angular, or any SPA-based sites
- Limited parsing. Complex HTML structures often break the import
- OneDrive sync conflicts cause data integrity issues
- No proxy rotation means IP bans on any significant scraping volume
Bottom line: Fine for a single report from a static webpage. Not a data pipeline.
Method 4: TabPy (Python + Tableau extensions)
How it works: TabPy is Tableau’s official Python server. It executes Python scripts inside Tableau calculated fields using functions like SCRIPT_REAL and SCRIPT_STR. In theory, web scraping logic runs directly inside Tableau through TabPy.
Why use it: Python has extensive scraping libraries, and TabPy is officially supported by Tableau.
Critical limitations:
- Requires a running TabPy server – additional infrastructure to maintain
- Scraping inside Tableau calculated fields is an anti-pattern. It’s slow, unreliable, and blocks dashboard rendering
- No proxy rotation means your TabPy server’s IP gets banned immediately on high-volume targets
- No CAPTCHA solving, no retry logic, no JavaScript rendering
- Calculated fields have execution time limits, so complex scraping jobs time out
- Debugging is extremely difficult because errors show up as unclear Tableau error messages
Bottom line: TabPy is great for running ML models and statistical calculations within Tableau. It isn’t suitable for web scraping.
Method 5: DIY Python scripts (requests, Scrapy, Selenium)
How it works: Write custom Python scripts using libraries like requests, BeautifulSoup, Scrapy, or Selenium. Run them on a schedule (such as cron or Airflow), output CSV/JSON files, and connect Tableau to those files.
Why use it: Maximum flexibility. You control everything.
Critical limitations:
- High maintenance burden – websites change layouts, add anti-bot measures, change HTML structures. Your scraper fails without warning, and the dashboard shows outdated data.
- IP blocking at scale – without a proxy network, targets block your server in hours
- No CAPTCHA solving – Cloudflare, reCAPTCHA, and hCaptcha block your scraper with no built-in workaround (services like Web Unlocker handle these automatically)
- Infrastructure costs – you need servers, proxy subscriptions, monitoring, and alerting
- Compliance risk – without proper infrastructure, you may violate GDPR, CCPA, or platform terms
- Doesn’t scale – scraping 100 URLs is different from scraping 100,000. The architecture that works for one fails completely at the other.
Bottom line: DIY is viable initially, but not reliable long-term. Most teams start here, and many succeed at first. But the maintenance effort increases over time.
It works well in the first month, but after several months you spend more time fixing broken selectors and IP bans than building dashboards. If you’re scraping one or two sites at low volume, DIY scripts may be all you need.
Method 6: Bright Data Web Scraper API (recommended)
How it works: Bright Data’s Web Scraper API handles the entire data collection layer: proxy rotation, CAPTCHA solving, JavaScript rendering, anti-bot bypass, and structured data output. You trigger a collection job via API, receive clean JSON/CSV data, and load it into Tableau.
Advantages:
| Capability | Bright Data | DIY Scripts |
|---|---|---|
| Proxy network | 400M+ IPs across 195 countries | Buy your own (expensive) |
| Ready-made scrapers | 120+ for major platforms | Build from scratch |
| CAPTCHA solving | Automatic | Not included |
| JavaScript rendering | Built-in | Requires Selenium/Playwright |
| Anti-bot bypass | Automatic | Requires constant manual updates |
| Uptime | 99.99% | Depends on your infra |
| Compliance | GDPR, CCPA, ISO 27001 | Your responsibility |
| Maintenance | Minimal – Bright Data handles scraper updates | Constant |
| Scale | Millions of pages/day | Limited by your servers |
| Pricing | From $1.50/1K records | Variable (servers + proxies + maintenance) |
Bottom line: You focus on Tableau dashboards; Bright Data handles the data collection infrastructure.
Trade-off: Bright Data is a paid, third-party service. You depend on its infrastructure and pricing model. For occasional scraping of one or two sites at low volume, a DIY script (Method 5) costs less and gives you full control.
Which Tableau data connection method should you choose?
This table compares all six methods across the capabilities that matter most for production pipelines.
| Method | JS Rendering | Proxy Rotation | CAPTCHA Solving | Auto-Refresh | Scale | Maintenance | Status |
|---|---|---|---|---|---|---|---|
| WDC v2 | No | No | No | Yes | Low | N/A | Deprecated |
| Google Sheets | No | No | No | Unreliable | Very Low | Low | Cell limits |
| Excel + OneDrive | No | No | No | Manual | Very Low | Medium | Manual process |
| TabPy | Manual/DIY | No | No | Yes | Low | High | IP bans |
| DIY Python | Via Selenium | DIY | No | Via cron | Medium | Very High | Breaks at scale |
| Bright Data API | Yes | Yes (400M+ IPs) | Yes | Yes | High | Minimal | Production-ready |
Tutorial: connect a web scraping API to Tableau
This tutorial builds a real pipeline: Amazon product prices → Bright Data API → CSV → Tableau dashboard using the Amazon Scraper API. It covers the “Competitor Price Monitoring” use case, the most common reason teams connect web data to Tableau.
Architecture
The pipeline follows this flow:
┌─────────────────┐     ┌──────────────────────┐      ┌─────────────┐     ┌─────────────┐
│   Your Script   │────▶│  Bright Data Scraper │────▶ │  CSV/JSON   │────▶│   Tableau   │
│  (Python/cron)  │     │       API            │      │   Output    │     │  Dashboard  │
└─────────────────┘     └──────────────────────┘      └─────────────┘     └─────────────┘
        │                        │                                              │
   Trigger with            Handles proxies,                              Visualize prices,
   keywords/URLs          CAPTCHAs, rendering                           ratings, trends
Prerequisites
You’ll need the following installed or available before starting:
- Python 3.8+
- A Bright Data account (free tier available, no credit card required)
- Your API token from the Bright Data dashboard (instructions in Step 0)
- Tableau Desktop (14-day free trial), Tableau Cloud, or Tableau Public (free, dashboards are public)
With these tools ready, start by generating your Bright Data API token.
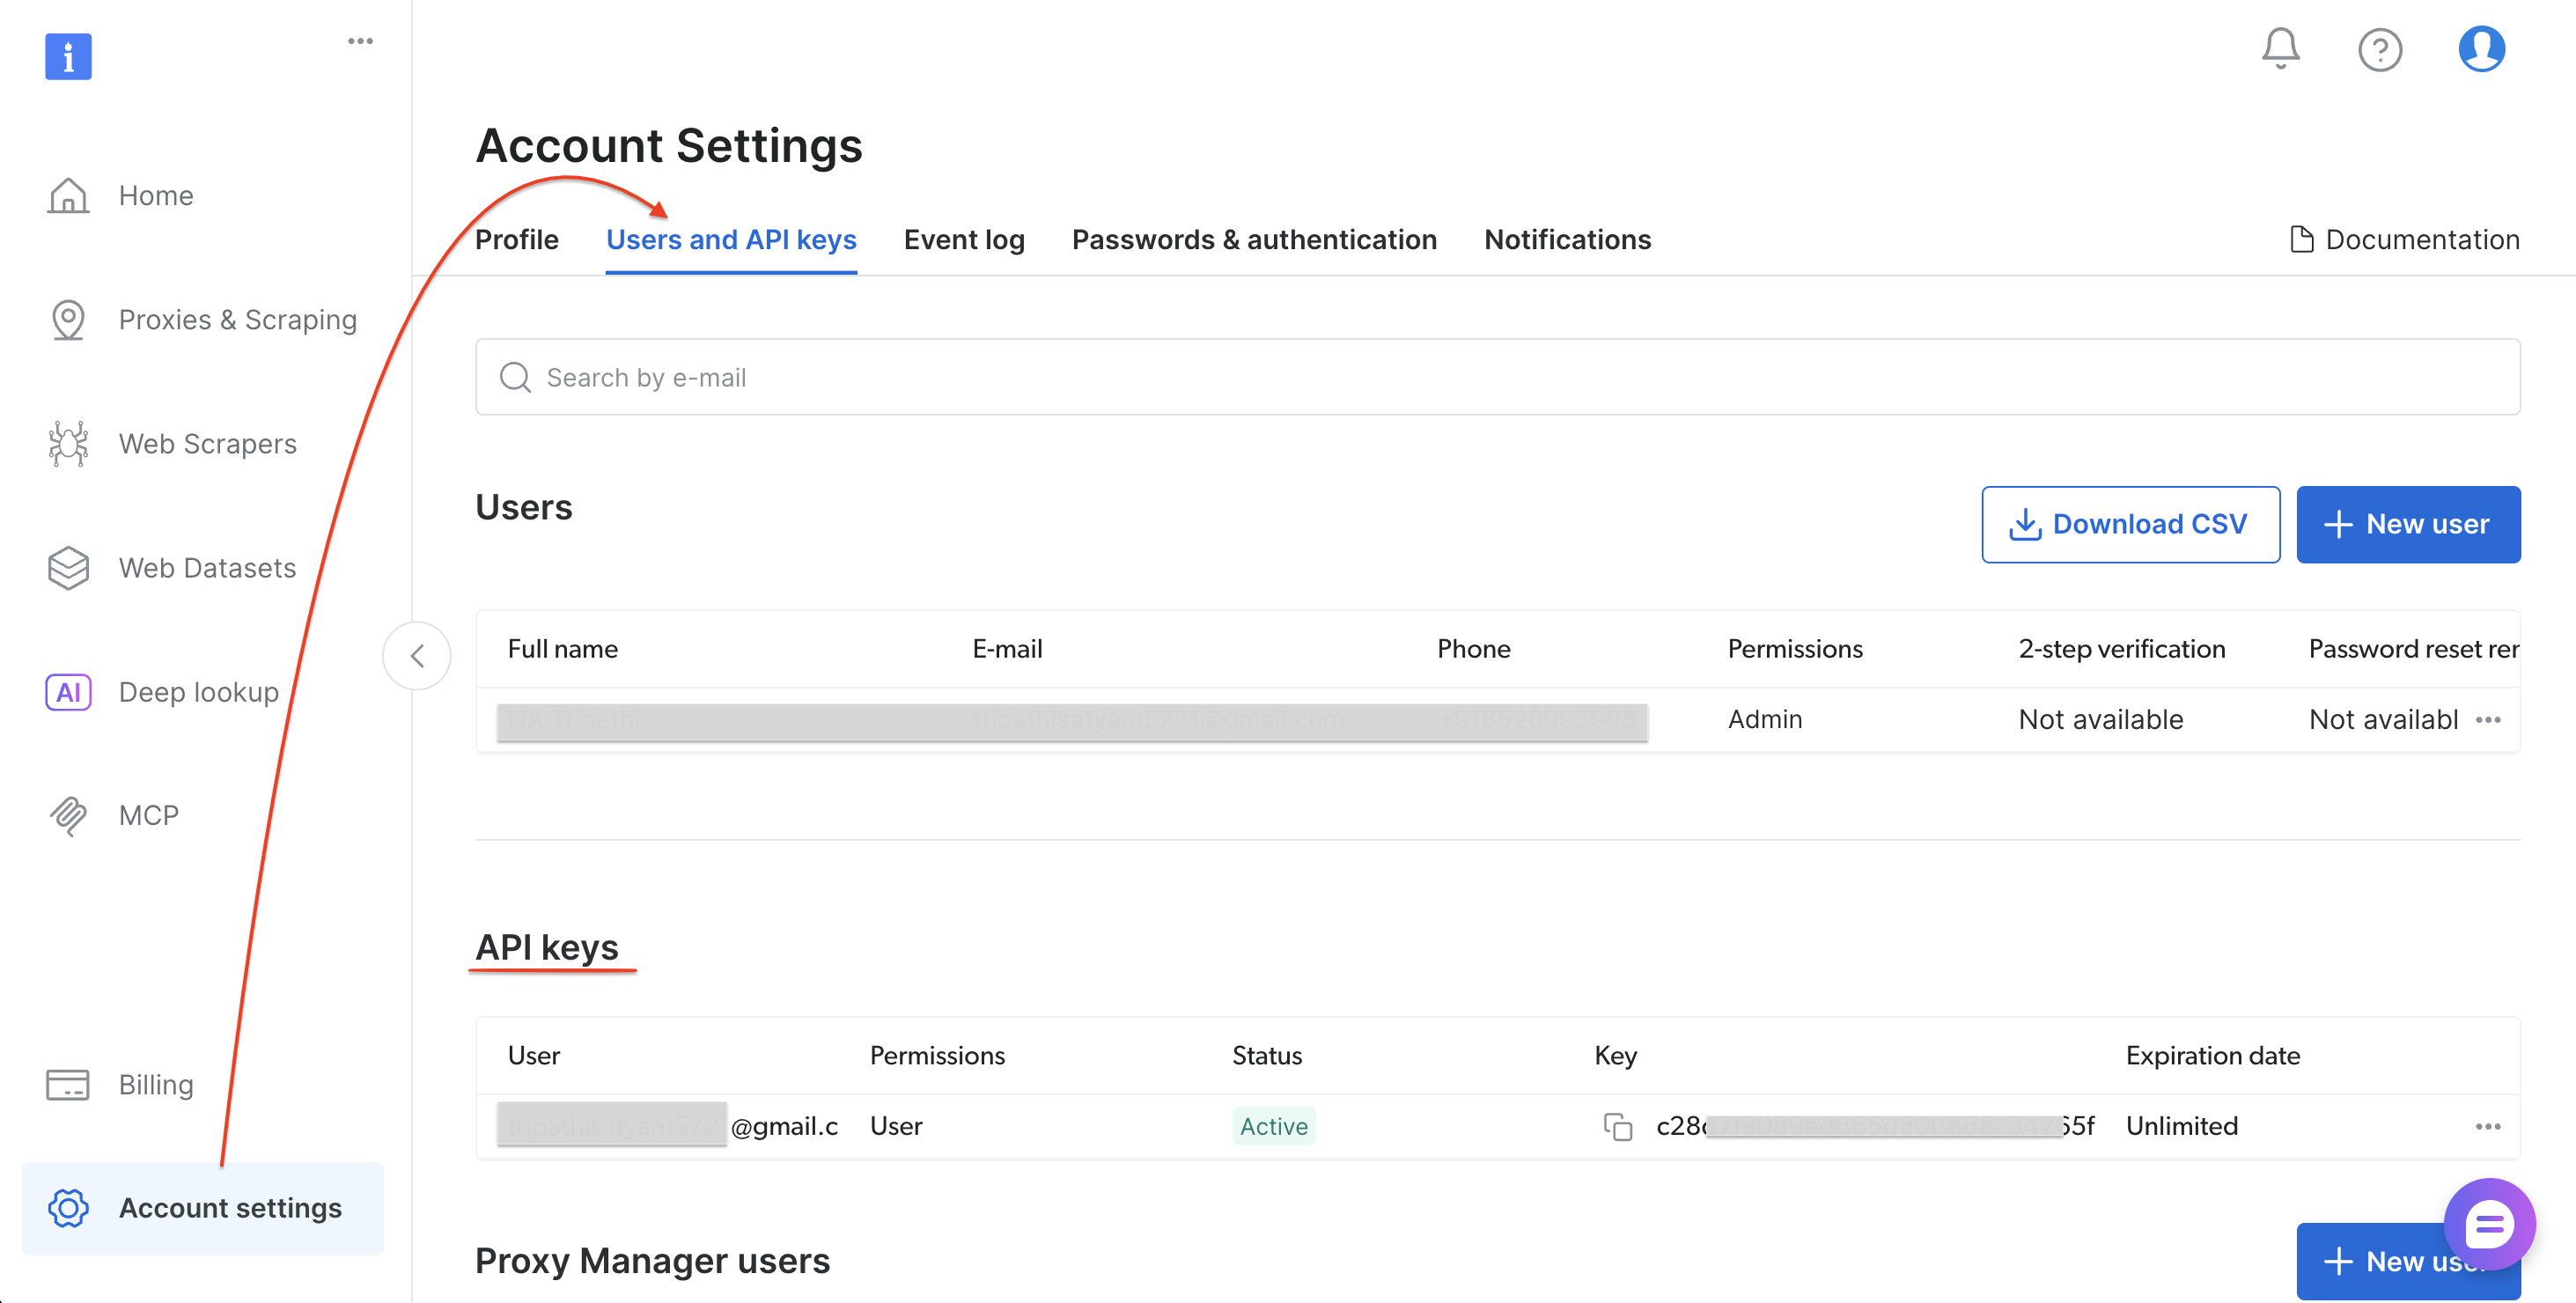
Step 0: Get your Bright Data API token
Follow these steps to generate your API token:
- Sign up or log in at brightdata.com/cp
- Go to Account settings → Users and API keys
- Select “Add API key” (top-right of the API key section)
- Set permissions and expiration, then select Save
- Copy the token
With your API token saved, install the Python dependencies.
Step 1: Install dependencies
Install the required Python packages:
pip install requests pandasWith requests and pandas installed, create the pipeline script.
Step 2: The pipeline script
Create a file called bright_data_to_tableau.py:
"""
Bright Data → Tableau Pipeline
Scrapes Amazon product data via Bright Data's Web Scraper API
and outputs a Tableau-ready CSV file.

Usage:
    1. Replace YOUR_API_TOKEN with your Bright Data API token
    2. Run: python bright_data_to_tableau.py
    3. Open the output CSV in Tableau Desktop
"""

import requests
import time
import json
import sys
import pandas as pd
from datetime import datetime

# ─── Configuration ───────────────────────────────────────────────────────────
API_TOKEN = "YOUR_API_TOKEN"               # Replace with your Bright Data API token
DATASET_ID = "gd_lwdb4vjm1ehb499uxs"       # Amazon Products Search (by keyword)
OUTPUT_CSV = "amazon_products_tableau.csv"
POLL_INTERVAL = 10                         # seconds between status checks
POLL_TIMEOUT = 300                         # max wait time in seconds

# ─── API Endpoints ───────────────────────────────────────────────────────────
TRIGGER_URL = (
    f"https://api.brightdata.com/datasets/v3/trigger"
    f"?dataset_id={DATASET_ID}&include_errors=true"
)
SNAPSHOT_URL = "https://api.brightdata.com/datasets/v3/snapshot"

HEADERS = {
    "Authorization": f"Bearer {API_TOKEN}",
    "Content-Type": "application/json",
}


def trigger_collection(keyword: str) -> str:
    """Trigger a data collection job on Bright Data."""
    payload = [{
        "keyword": keyword,
        "url": "https://www.amazon.com",
        "pages_to_search": 1
    }]

    print(f"[1/3] Triggering collection for keyword: '{keyword}'...")
    response = requests.post(TRIGGER_URL, headers=HEADERS, data=json.dumps(payload))

    if response.status_code != 200:
        print(f"  ERROR {response.status_code}: {response.text}")
        sys.exit(1)

    result = response.json()
    snapshot_id = result.get("snapshot_id")
    print(f"  Snapshot ID: {snapshot_id}")
    return snapshot_id


def poll_snapshot(snapshot_id: str) -> list:
    """Poll the snapshot endpoint until data is ready."""
    url = f"{SNAPSHOT_URL}/{snapshot_id}?format=json"
    elapsed = 0

    print(f"[2/3] Waiting for results...")

    while elapsed < POLL_TIMEOUT:
        response = requests.get(url, headers=HEADERS)

        if response.status_code == 200:
            data = response.json()
            print(f"  Ready! Received {len(data)} records.")
            return data
        elif response.status_code == 202:
            print(f"  Processing... ({elapsed}s / {POLL_TIMEOUT}s)")
            time.sleep(POLL_INTERVAL)
            elapsed += POLL_INTERVAL
        else:
            print(f"  ERROR {response.status_code}: {response.text}")
            sys.exit(1)

    print(f"  TIMEOUT: Snapshot not ready after {POLL_TIMEOUT}s.")
    print(f"  Try increasing POLL_TIMEOUT or check Bright Data dashboard.")
    sys.exit(1)


def to_tableau_csv(data: list, output_path: str) -> pd.DataFrame:
    """Transform raw API data into a clean, Tableau-optimized CSV."""
    df = pd.DataFrame(data)

    # Map API field names → Tableau-friendly names
    column_mapping = {
        "title": "Product Name",
        "seller_name": "Seller",
        "brand": "Brand",
        "initial_price": "Original Price",
        "final_price": "Current Price",
        "currency": "Currency",
        "rating": "Rating",
        "reviews_count": "Review Count",
        "availability": "Availability",
        "url": "Product URL",
        "asin": "ASIN",
        "categories": "Categories",
        "delivery": "Delivery Info",
    }

    # Keep only columns present in the data
    available = {k: v for k, v in column_mapping.items() if k in df.columns}
    df = df.rename(columns=available)
    df = df[list(available.values())]

    # Add metadata for Tableau filtering & tracking
    df["Scrape Date"] = datetime.now().strftime("%Y-%m-%d")
    df["Scrape Timestamp"] = datetime.now().isoformat()
    df["Data Source"] = "Bright Data API"

    df.to_csv(output_path, index=False)
    print(f"[3/3] Saved {len(df)} rows → {output_path}")
    return df


def print_summary(df: pd.DataFrame):
    """Print a summary of the scraped data."""
    print(f"\n{'─'*50}")
    print(f"  Summary")
    print(f"{'─'*50}")
    print(f"  Total products : {len(df)}")

    if "Current Price" in df.columns:
        prices = pd.to_numeric(df["Current Price"], errors="coerce")
        print(f"  Price range    : ${prices.min():.2f} – ${prices.max():.2f}")
        print(f"  Average price  : ${prices.mean():.2f}")

    if "Brand" in df.columns:
        print(f"  Unique brands  : {df['Brand'].nunique()}")

    if "Rating" in df.columns:
        ratings = pd.to_numeric(df["Rating"], errors="coerce")
        print(f"  Avg rating     : {ratings.mean():.1f} / 5.0")

    print(f"{'─'*50}\n")


def run_pipeline(keyword: str):
    """Execute the full pipeline: Trigger → Poll → CSV → Summary."""
    print(f"\n{'='*50}")
    print(f"  Bright Data → Tableau Pipeline")
    print(f"  Keyword: '{keyword}'")
    print(f"{'='*50}\n")

    snapshot_id = trigger_collection(keyword)
    data = poll_snapshot(snapshot_id)
    df = to_tableau_csv(data, OUTPUT_CSV)
    print_summary(df)
    return df


if __name__ == "__main__":
    # Default keyword — change this or pass as CLI argument
    keyword = sys.argv[1] if len(sys.argv) > 1 else "wireless headphones"
    run_pipeline(keyword)
Step 3: Run the script
Run the pipeline script:
python bright_data_to_tableau.pyExpected output:
==================================================
  Bright Data → Tableau Pipeline
  Keyword: 'wireless headphones'
==================================================

[1/3] Triggering collection for keyword: 'wireless headphones'...
  Snapshot ID: sd_mmlan9p51yycmmkd7d
[2/3] Waiting for results...
  Processing... (0s / 300s)
  Ready! Received 43 records.
[3/3] Saved 43 rows → amazon_products_tableau.csv

──────────────────────────────────────────────────
  Summary
──────────────────────────────────────────────────
  Total products : 43
  Price range    : $0.00 – $169.95
  Average price  : $45.98
  Unique brands  : 4
  Avg rating     : 4.4 / 5.0
──────────────────────────────────────────────────
The CSV is ready. Open it in Tableau to start building dashboards.
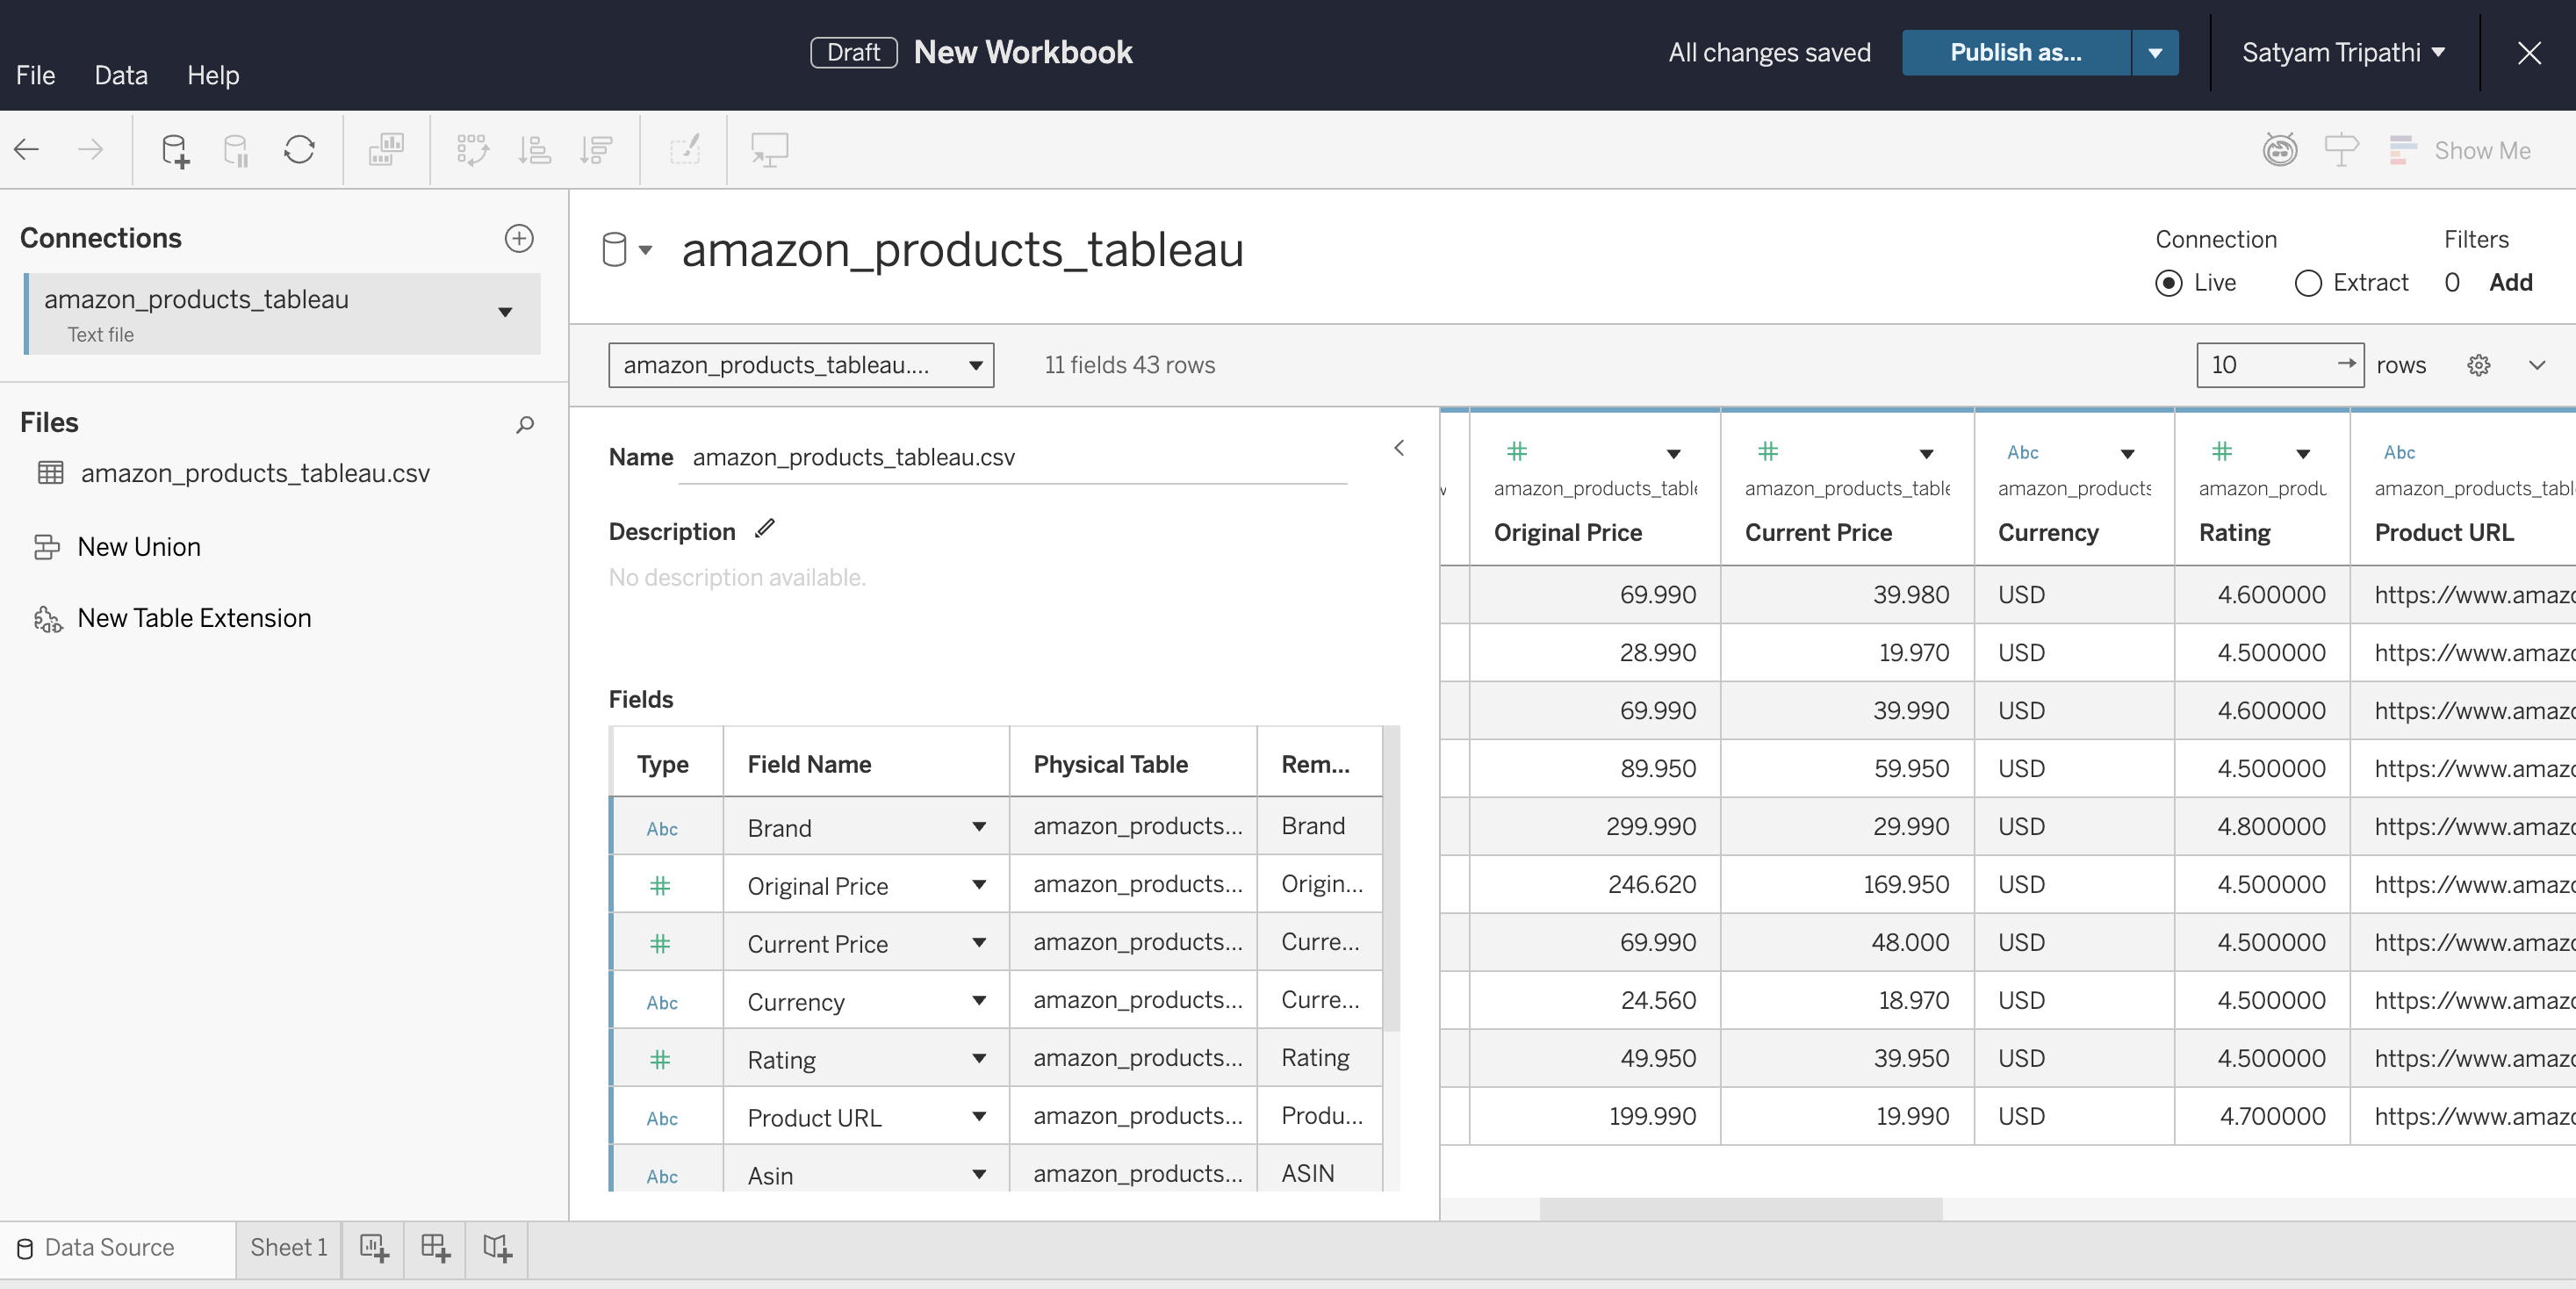
Step 4: Connect to Tableau
Load the CSV into Tableau and verify the data types:
- Open Tableau Desktop, Tableau Cloud, or Tableau Public
- Connect to the CSV: in Desktop, select Connect → Text File. In Cloud, select New → Workbook → Files tab and upload the file
- Verify that
Current PriceandRatingare detected as Number, not String - Select Sheet 1 to start building
Recommended dashboard views:
- Price Distribution – Histogram of
Current Priceto identify market positioning - Price Drop Analysis – Side-by-side bar chart of
Original PricevsCurrent Priceto identify discounts - Rating vs. Price – Scatter plot to find high-value products
- Brand Comparison – Bar chart grouping products by
Brandto compare pricing and ratings
Step 5: Automate the refresh
To keep your dashboard live, schedule the script with cron (Linux/Mac) or Task Scheduler (Windows):
# Run every 6 hours — crontab -e
0 */6 * * * cd /path/to/project && python bright_data_to_tableau.py
Refreshing Tableau to show the new data:
- Tableau Desktop. After the cron job updates the CSV, press F5 (Windows) or Command+R (Mac) to reload. Alternatively, select the data source in the Data menu and choose Refresh. Tableau Desktop doesn’t auto-refresh file-based sources on its own, so you’ll need to refresh manually or reopen the workbook.
- Tableau Server. From Tableau Desktop, publish via Server → Publish Workbook. In the publish dialog, set an Extract Refresh Schedule (for example, every 6 hours to match your cron job). Tableau Server will automatically refresh the extract on that schedule.
- Tableau Cloud. Browser-uploaded CSV files can’t be auto-refreshed. To automate refreshes, install Tableau Bridge on the machine running your cron job. Bridge connects your local CSV to Tableau Cloud and supports scheduled extract refreshes. Without Bridge, re-upload the CSV manually after each pipeline run.
- Tableau Public. Doesn’t support scheduled refreshes for file-based sources. For CSV-based pipelines, you’ll need to re-publish the workbook each time the data updates.
Step 6: Use any scraper (finding dataset IDs)
The tutorial uses the Amazon Products Search dataset (gd_lwdb4vjm1ehb499uxs). To scrape a different website, swap the dataset ID. Here’s how to find it:
- Log in to Bright Data’s control panel
- Select Web Scrapers in the sidebar to open the Web Scrapers Library
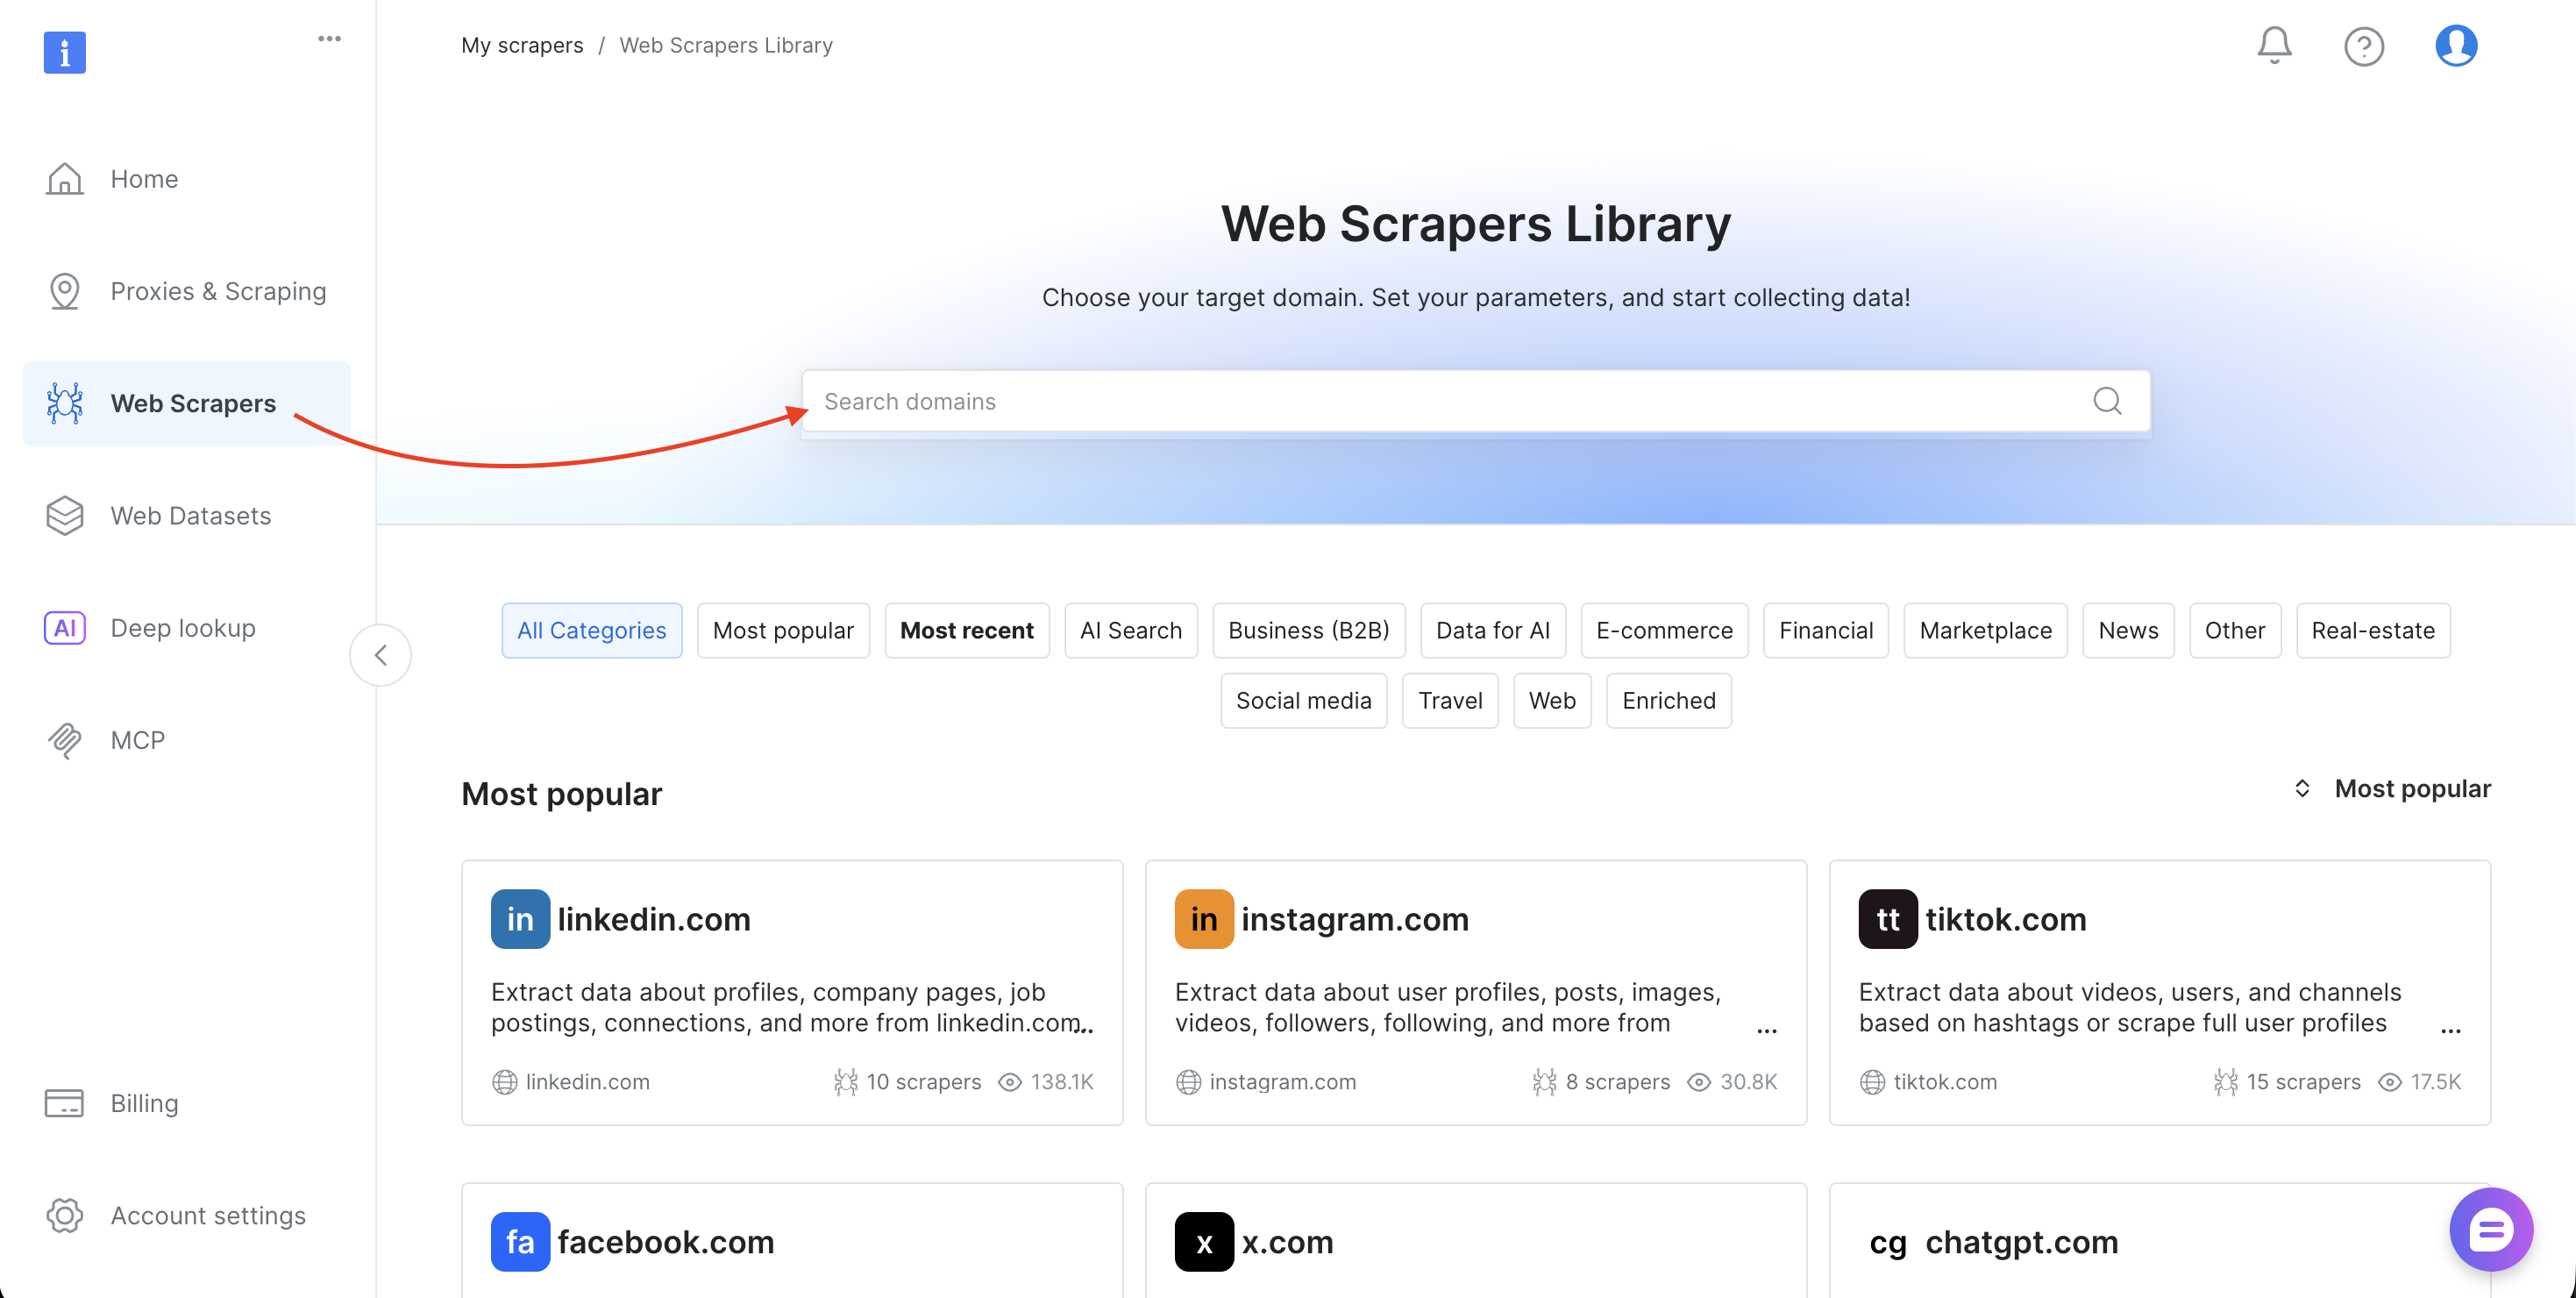
- Search for your target domain (such as amazon.com, zillow.com, or linkedin.com) and select it
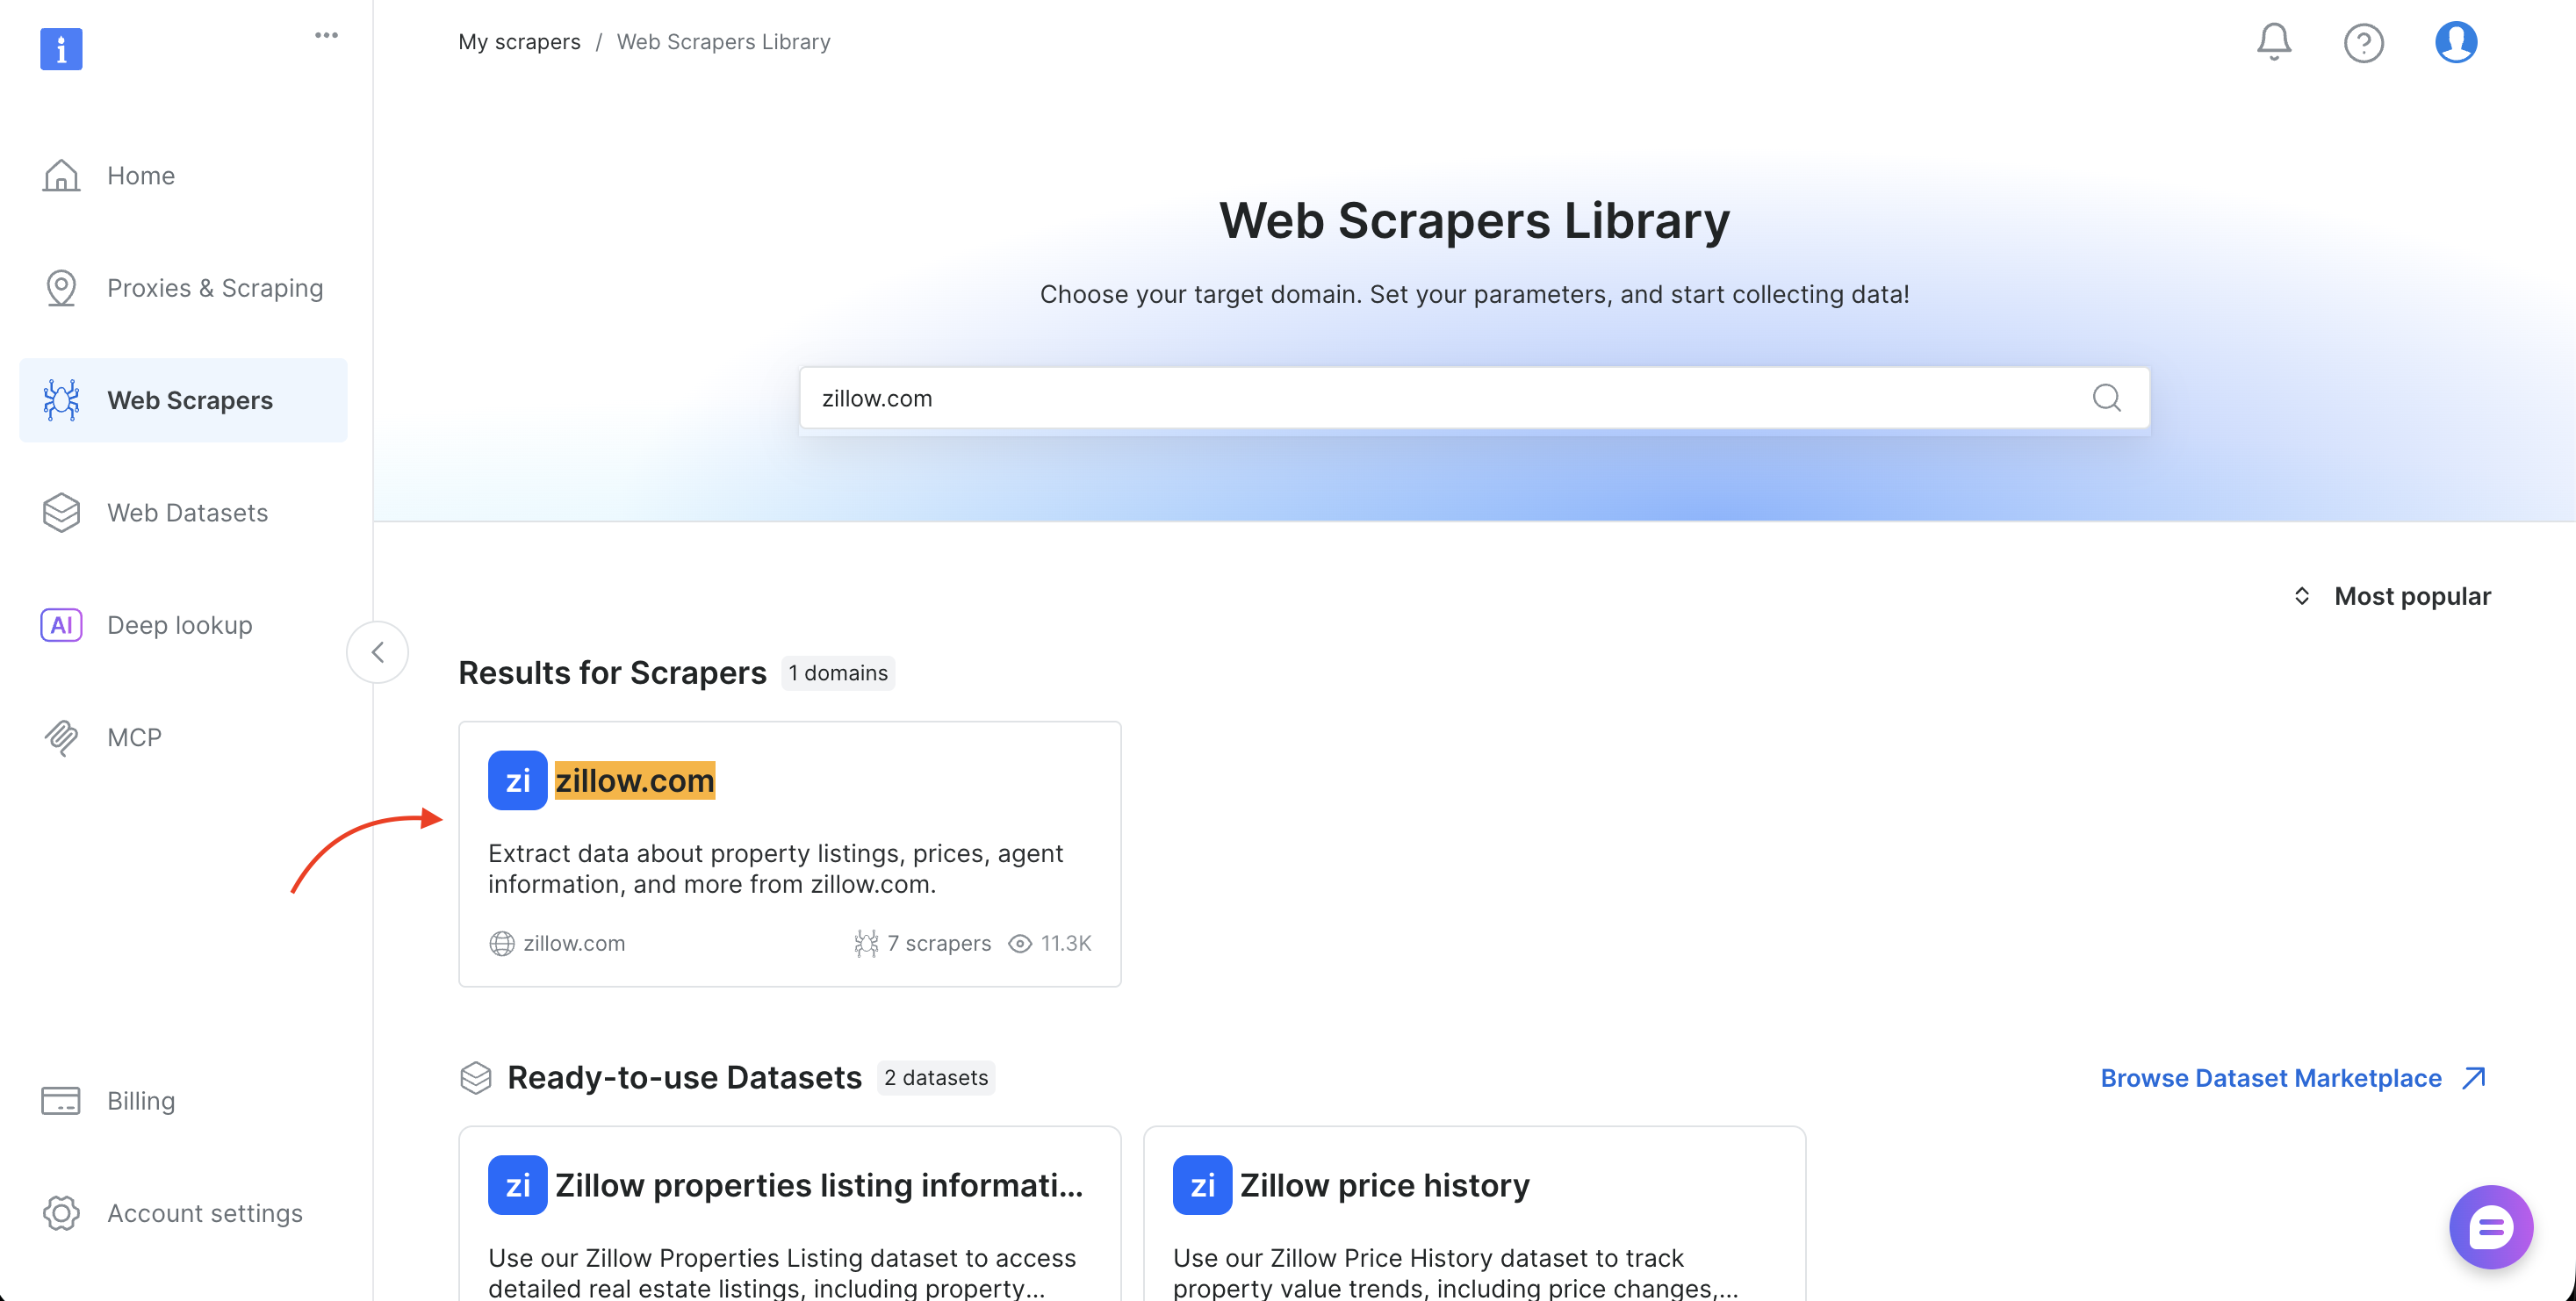
- Choose the collection method (Collect by URL or Discover by keyword)
- Copy the
dataset_idfrom the browser URL bar (for example,brightdata.com/cp/scrapers/gd_lfqkr8wm13ixtbd8f5) or from the Code examples panel
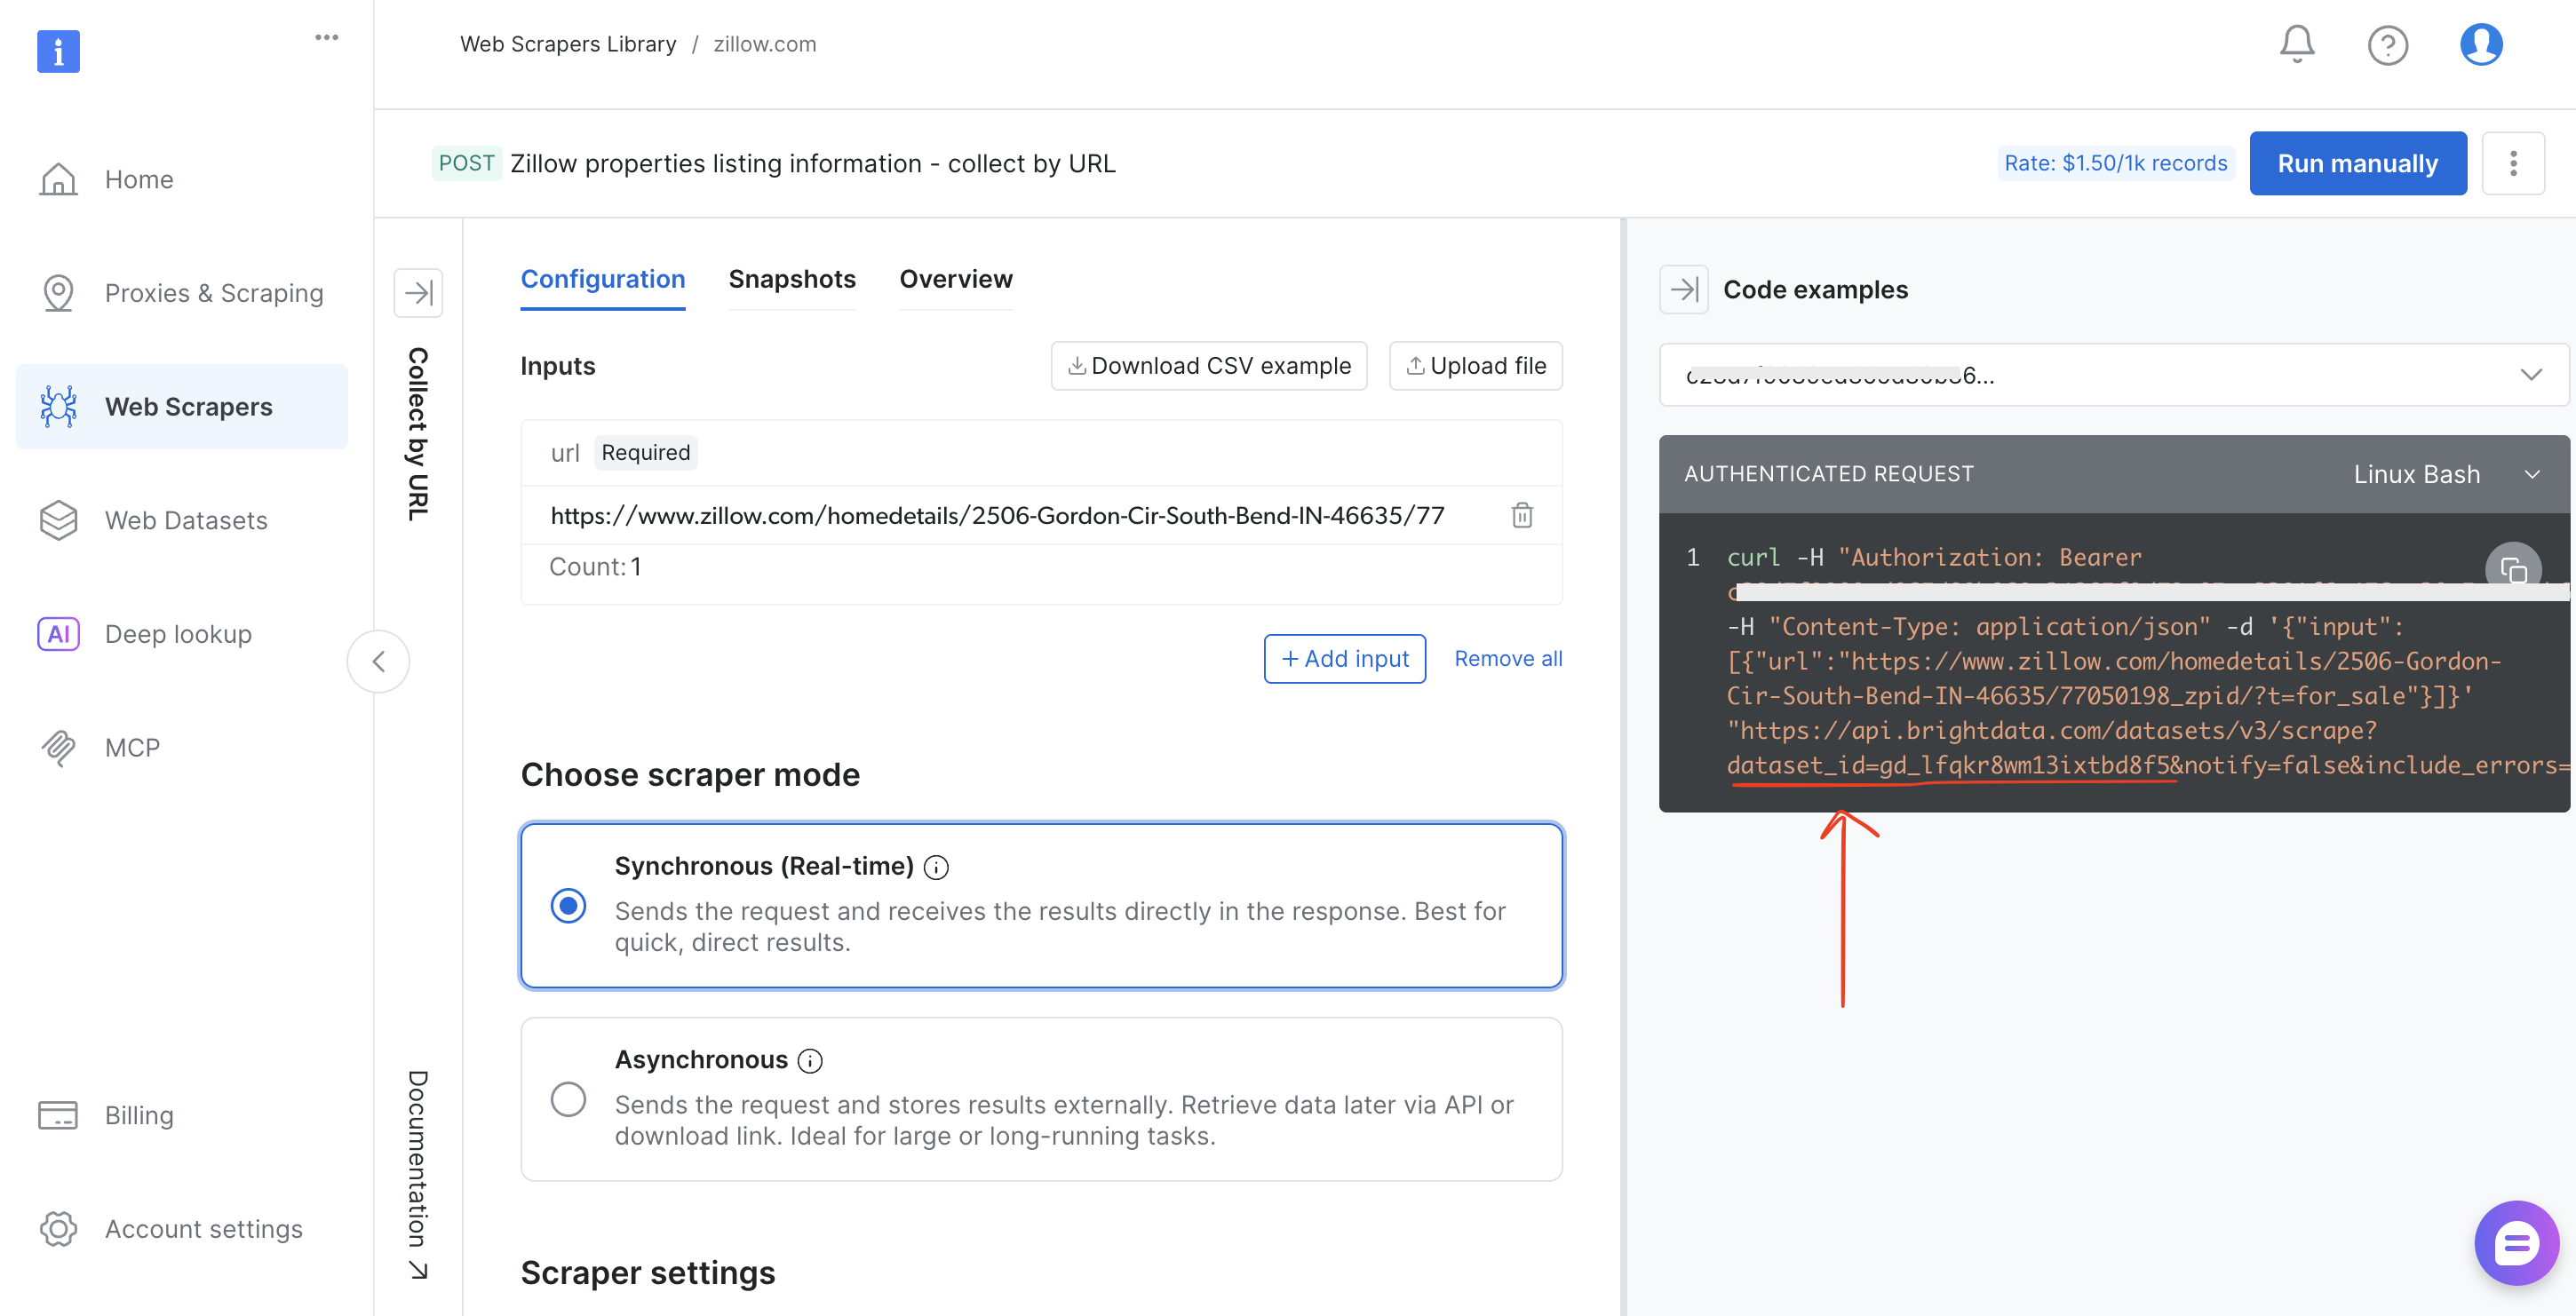
Replace DATASET_ID in the script, adjust the payload, and the same pipeline works for any of Bright Data’s 120+ scrapers.
Real results: what the scraped data looks like
The following screenshot shows the raw CSV output from the pipeline, exactly what Bright Data’s API returned for the keyword “wireless headphones”:
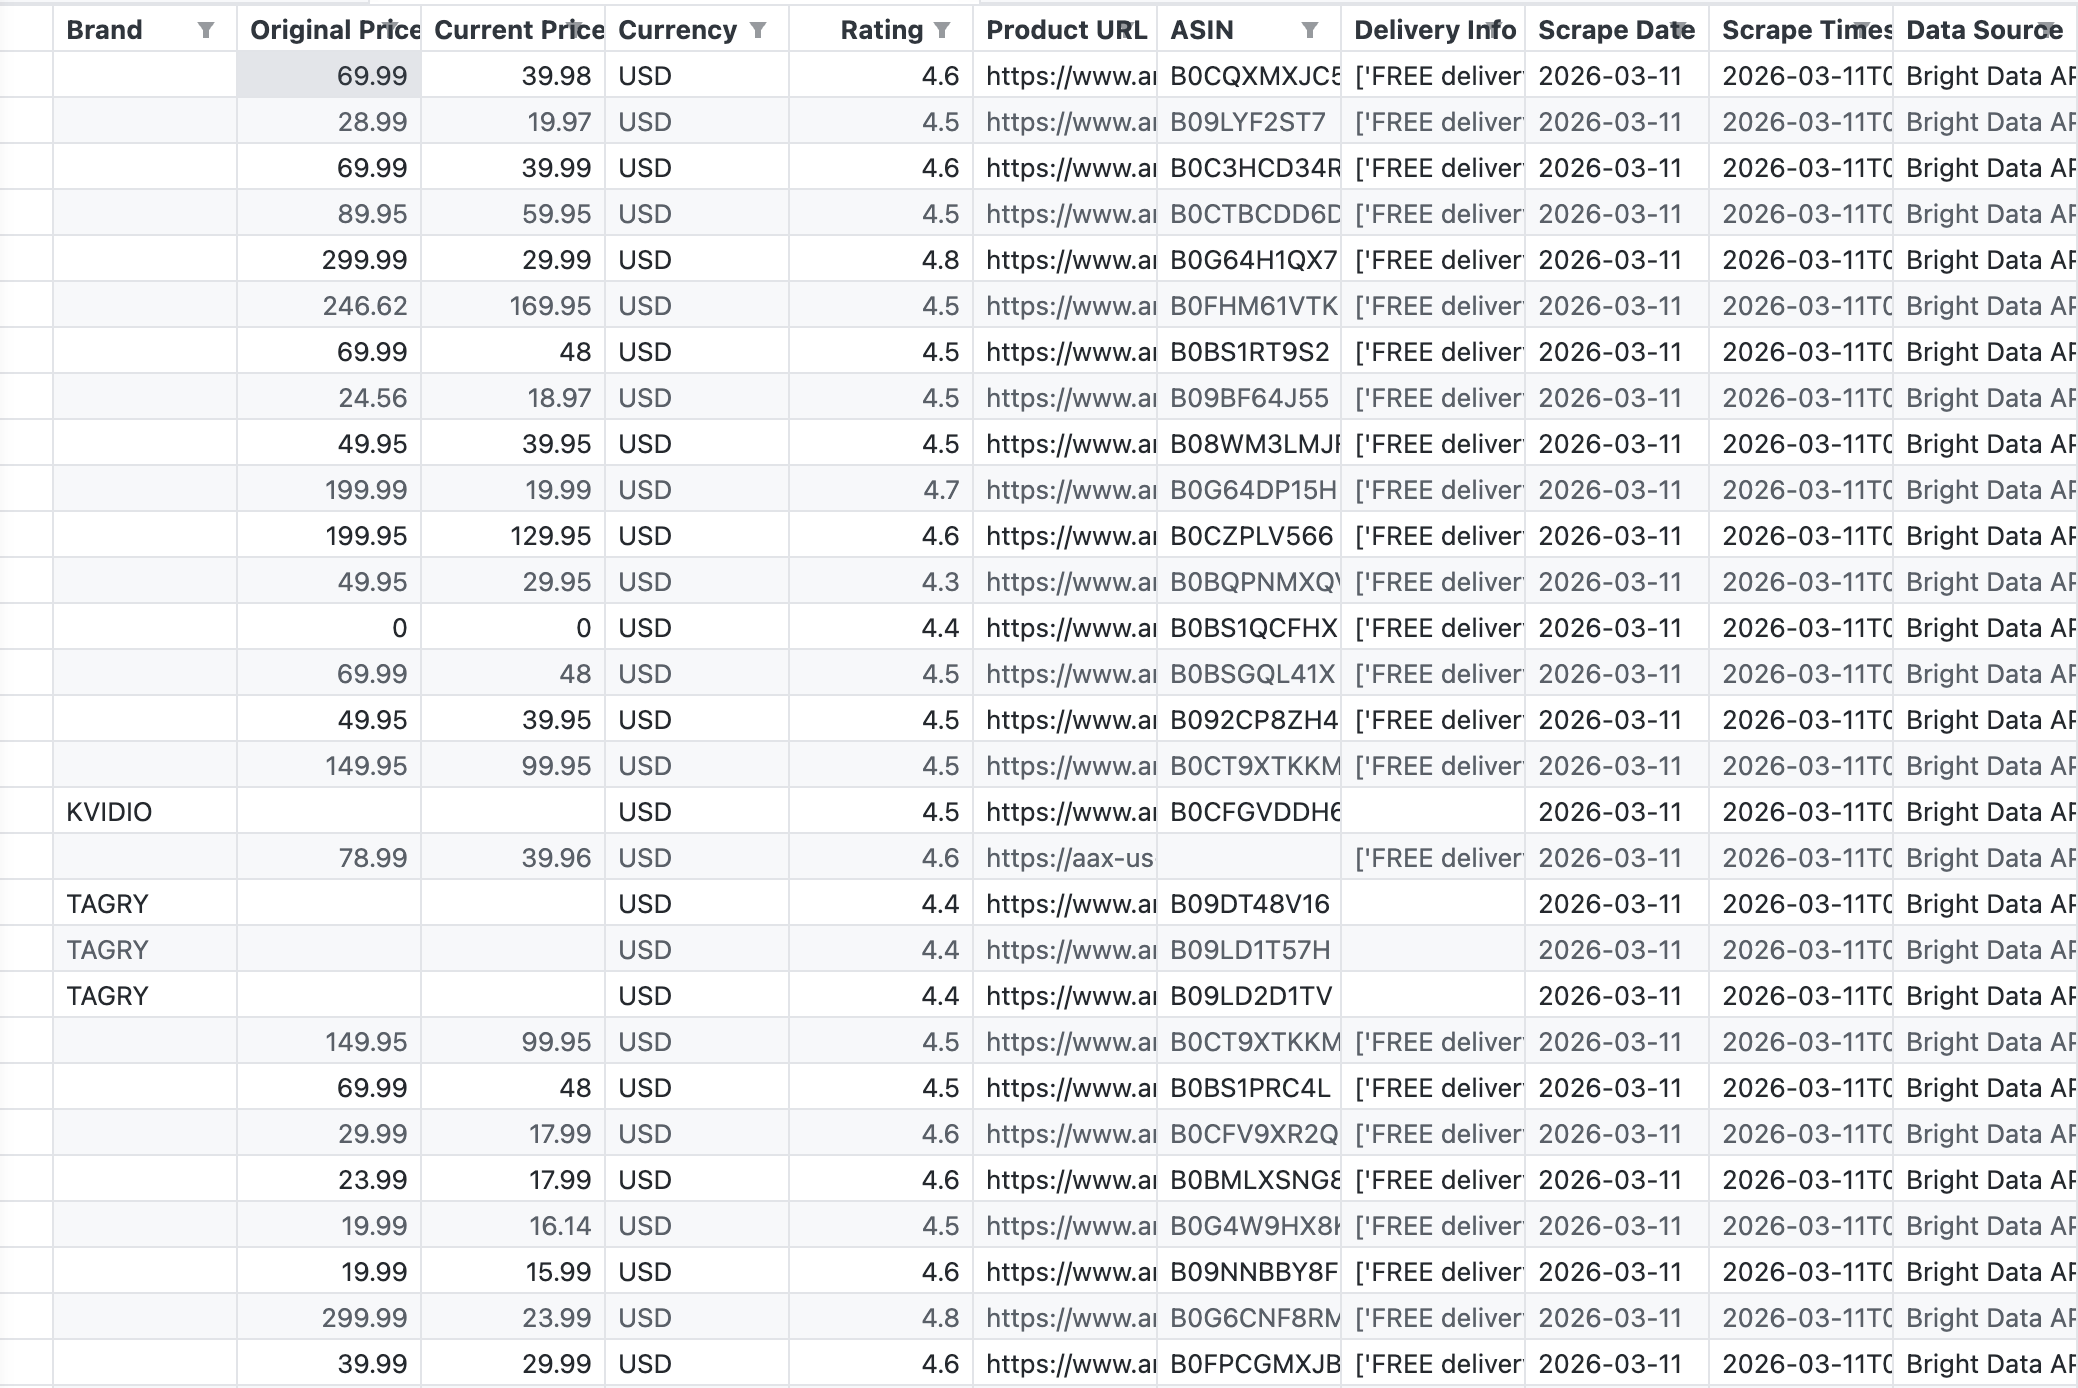
The API returned 43 records with fields including Brand, Original Price, Current Price, Rating, ASIN, Product URL, and Delivery Info.
The API returned 43 products in a single call. The data is structured and Tableau-ready. No HTML parsing, no broken selectors, no CAPTCHA challenges. For more details on Amazon scraping options, see How to Scrape Amazon Product Data.
Visualizing the data: from CSV to insights
These four visualizations show what the pipeline produces. Each view is built from the exact CSV the script generated:
Price distribution across products
This chart ranks 31 products (those with parseable names from their Amazon URLs) by current price, from lowest to highest:
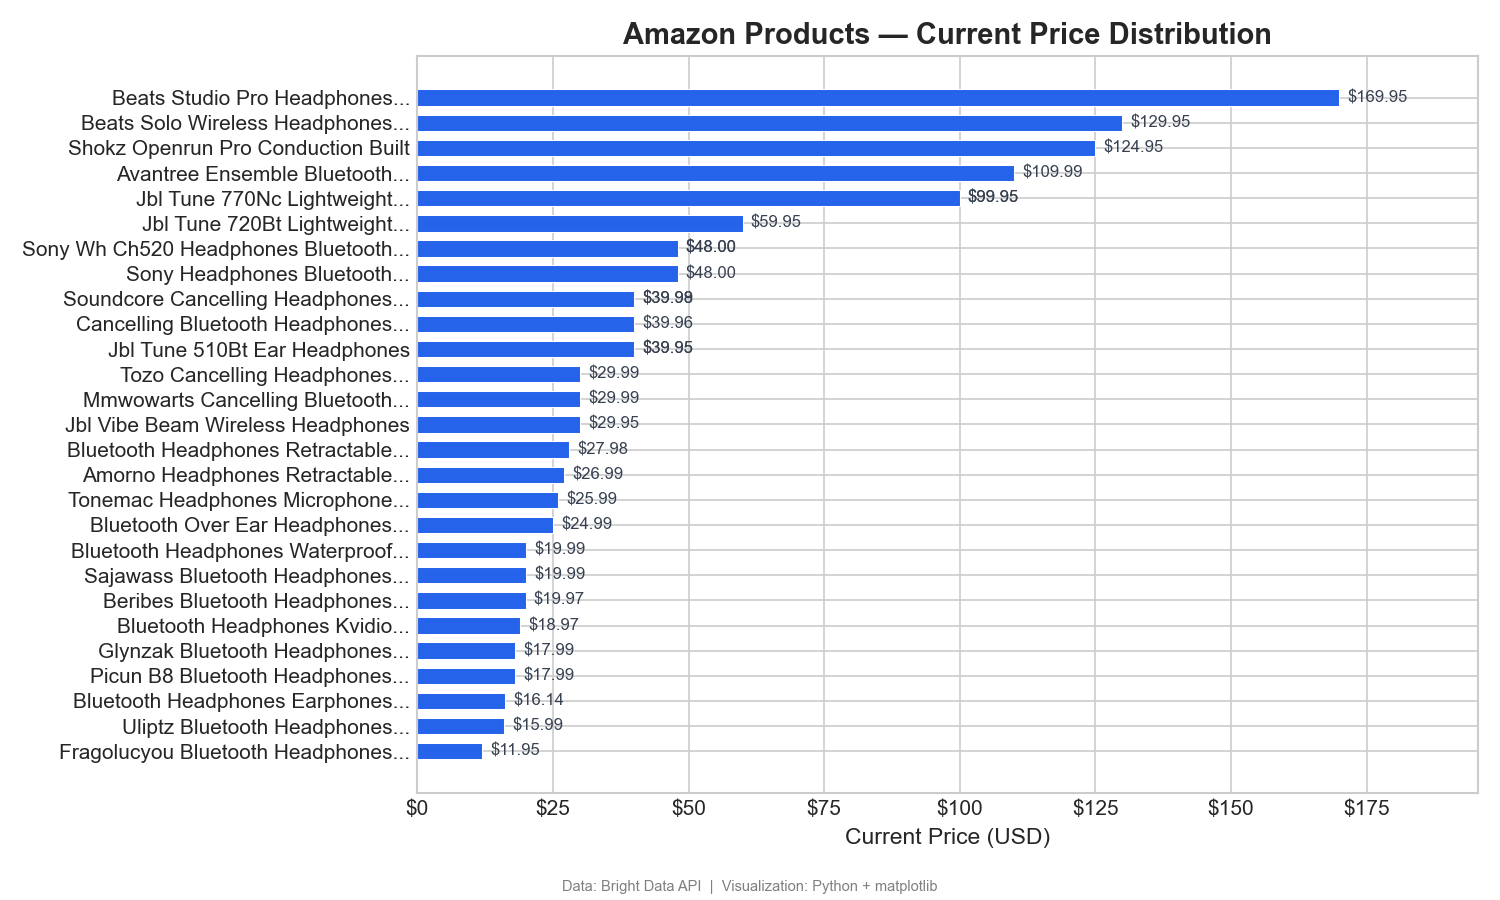
This horizontal bar chart shows the price range clearly: Beats dominates the premium bracket ($125–$170), while most wireless headphones cluster in the $12–$60 range. In Tableau, you’d build this as a sorted bar chart with Current Price on Columns and Product Name on Rows.
Price drops: original vs current price
This grouped bar chart compares listed and current prices for the top 10 discounted products:
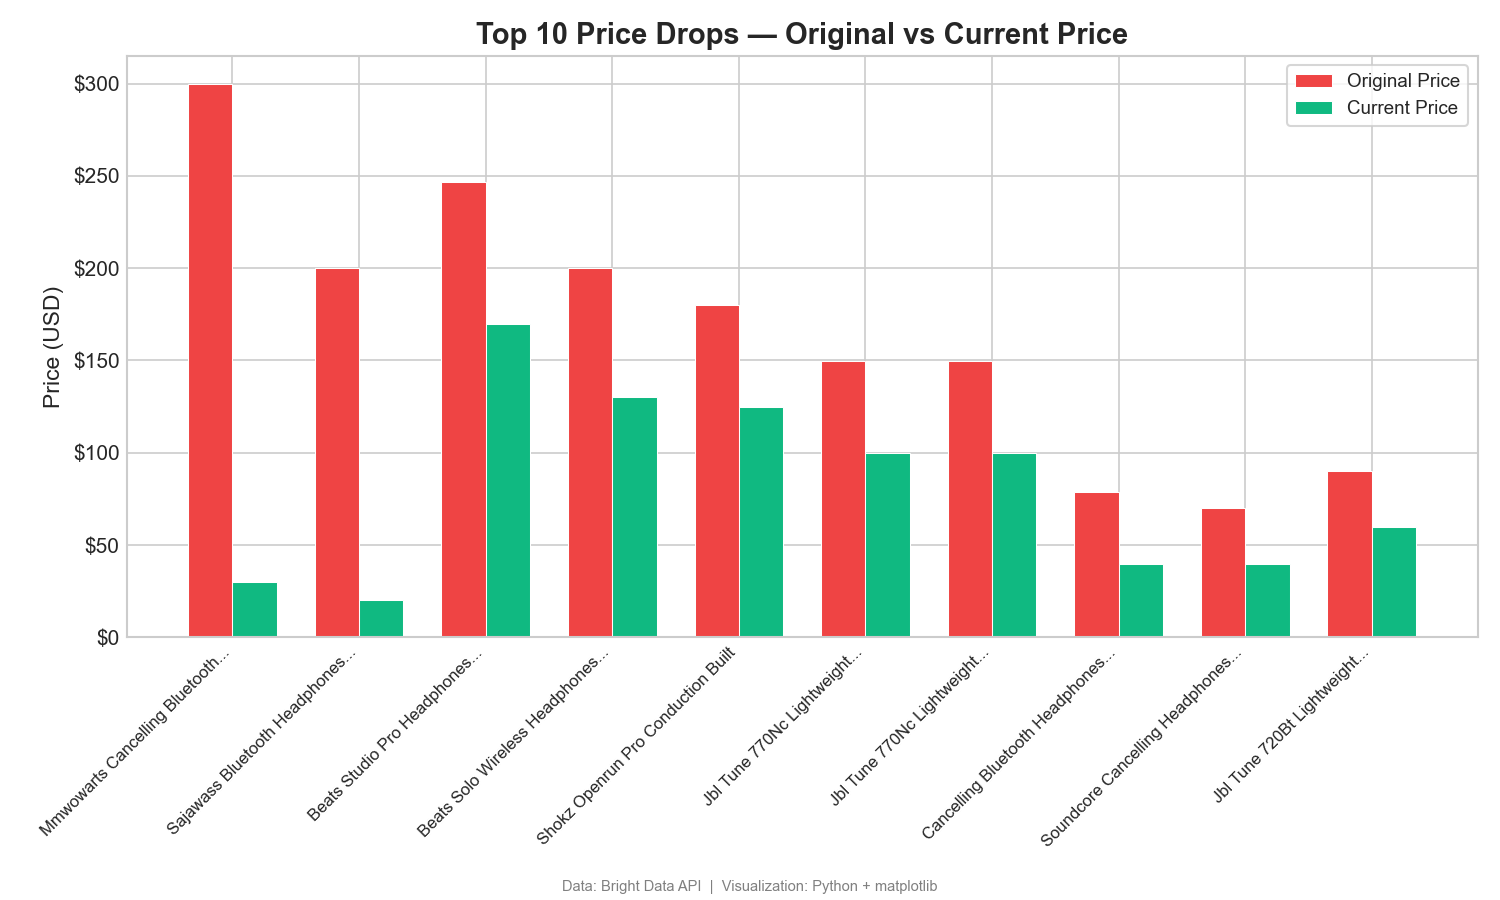
The gap between original and current price shows large discounts. One product shows a $270 drop from its listed original price ($299.99 → $29.99). Gaps like this show promotional and pricing strategies. In Tableau, use a side-by-side bar chart with Measure Names on Color.
Rating vs price: finding value
This scatter plot maps customer ratings against price to identify high-value products:
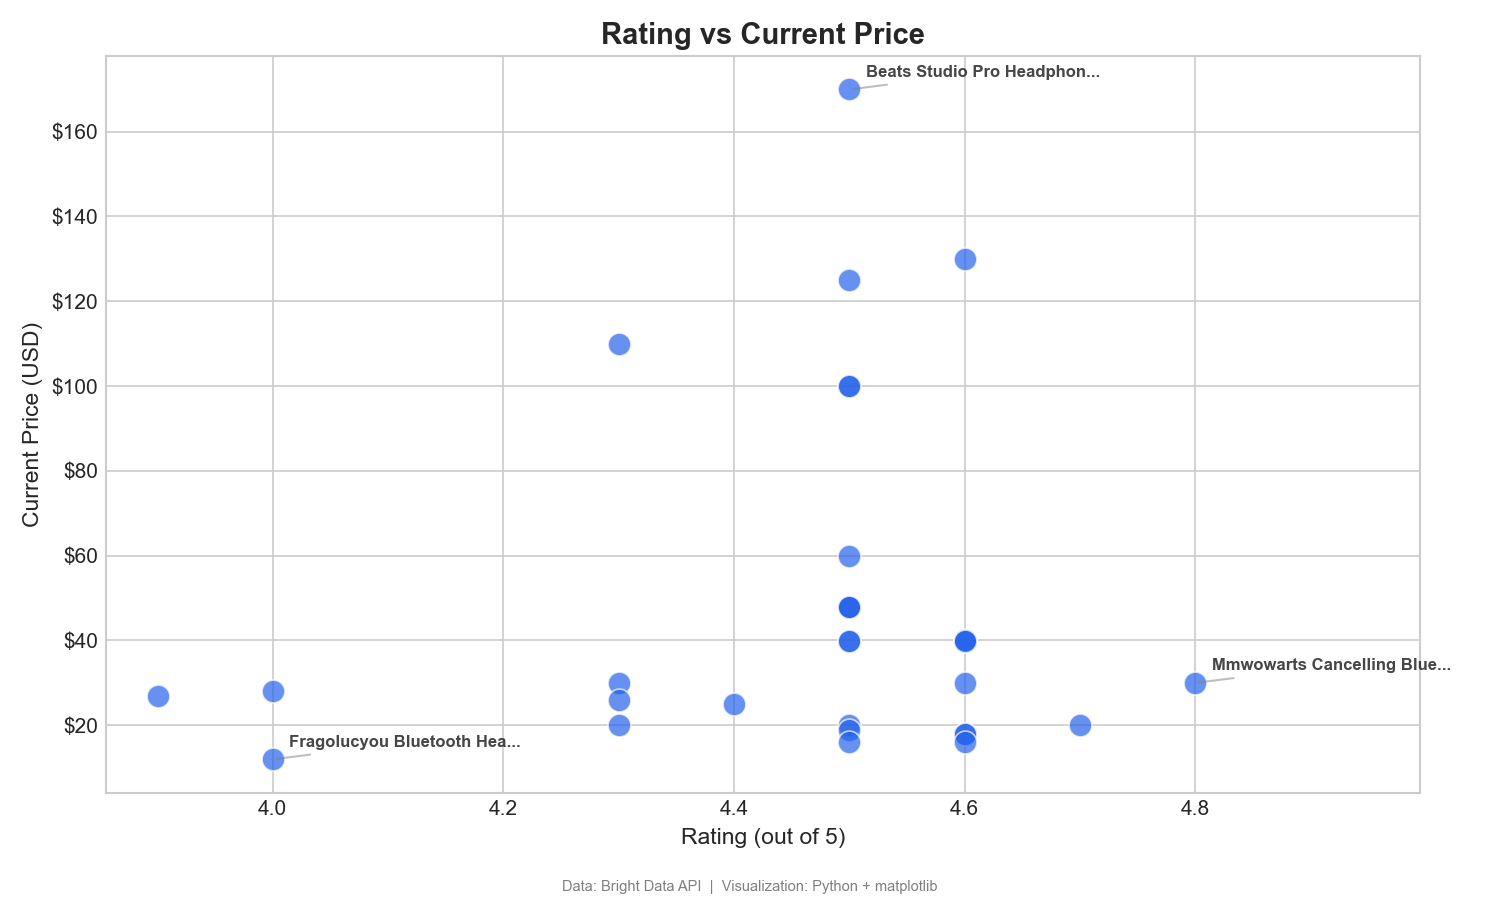
This scatter plot helps identify high-value products, those with high ratings and low prices (bottom-right quadrant). The MMWOWARTS headphones at $29.99 with a 4.8 rating are a clear example. In Tableau, drag Rating to Columns, Current Price to Rows, and Product Name to Detail.
Market segmentation by price range
This donut chart breaks down products by price range:
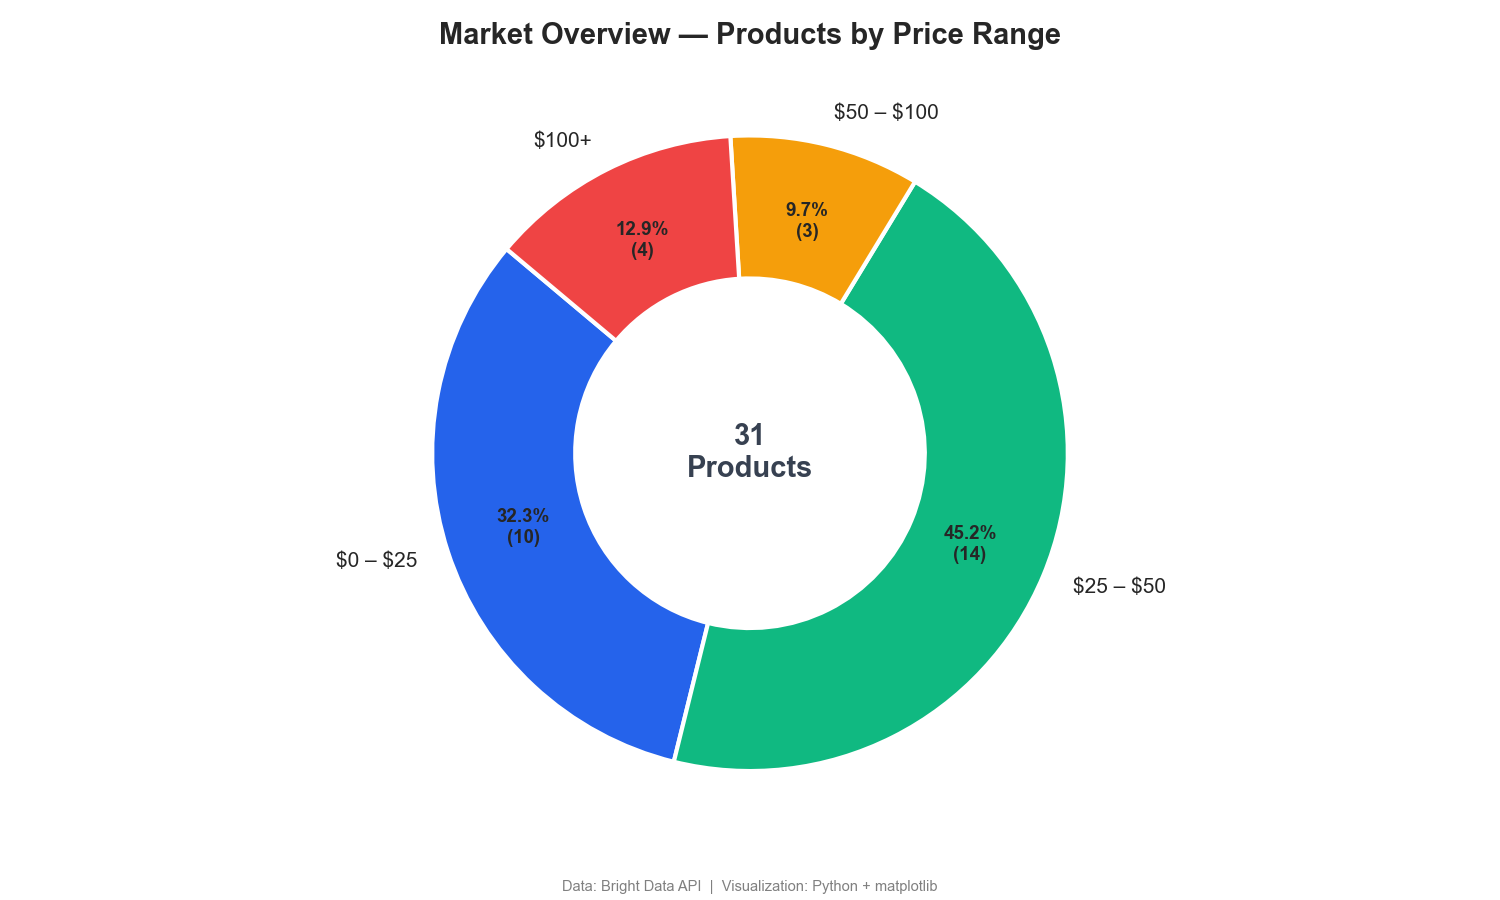
The donut chart shows that 77% of wireless headphones sell for under $50, with only 13% in the $100+ premium segment. Competitor price monitoring dashboards often include similar segmentation.
Bonus: real estate pipeline with Zillow
The same pipeline pattern works with any of Bright Data’s 120+ scrapers. The following example uses the Zillow Scraper API (GitHub repo). Update two variables in bright_data_to_tableau.py and the rest of the pipeline runs unchanged:
# Replace the Amazon dataset ID with the Zillow dataset ID
DATASET_ID = "gd_lfqkr8wm13ixtbd8f5"  # Zillow Properties
Then update the payload in trigger_collection() to use a location URL instead of a keyword:
payload = [{
    "url": "https://www.zillow.com/new-york-ny/"
}]
Run the script the same way. The polling and CSV export logic works without changes.
Zillow fields include: property address, price, bedrooms, bathrooms, square footage, lot size, year built, property type, listing status, and Zestimate.
Tableau dashboard ideas:
- Price-per-sqft heat map by ZIP code
- Listing price vs Zestimate gap analysis
- Home type distribution by city or ZIP code
- Year-built vs price scatter plot for renovation opportunities
The key benefit: you learn the pattern once, then apply it to any data source. Amazon, Zillow, LinkedIn jobs – all using the same Bright Data infrastructure to send data to Tableau dashboards.
Top 6 use cases for live web data in Tableau
These are the most common reasons teams build web data pipelines into Tableau.
1. Competitor price monitoring
Track competitor pricing across Amazon, Walmart, Target, or any eCommerce platform. Build Tableau dashboards that show daily price movements, historical trends, and price positioning across your market. Set up alerts when competitors drop below your minimum price.
Monitor thousands of SKUs across multiple marketplaces with Bright Data’s 120+ ready-made scrapers. No custom scrapers needed.
Tableau views: Price waterfall charts, time-series trends by SKU, competitor price heatmaps.
2. Social media brand tracking
Pull mentions, engagement metrics, follower counts, and comment data from Instagram, Twitter/X, TikTok, and LinkedIn. Build dashboards that track brand visibility across platforms and measure campaign performance over time. The Scraping Browser handles JavaScript-heavy social platforms that standard HTTP requests can’t render.
Tableau views: Engagement rate trends, mention volume over time, platform comparison bar charts.
3. Job market analytics
Aggregate job postings from Indeed, Glassdoor, LinkedIn (GitHub repo), and niche job boards. Analyze hiring trends, salary benchmarks, required skills, and demand shifts across industries and geographies. HR teams and recruiters use these dashboards to benchmark compensation and identify talent market shifts before competitors.
Tableau views: Geographic bubble maps of open roles, salary distribution histograms, skills demand treemaps.
4. Real estate dashboards
Monitor property listings, price changes, inventory levels, and neighborhood trends from Zillow, Realtor.com, Redfin, and Airbnb. Real estate investors and analysts build geographic heat maps in Tableau to identify undervalued markets and track rental yield trends across cities.
Tableau views: ZIP code heat maps, price-per-sqft scatter plots, listing volume time-series.
5. Financial data feeds
Collect stock prices, earnings reports, analyst ratings, insider trading data, and financial news from Yahoo Finance, Bloomberg, and other financial platforms. Quantitative analysts and portfolio managers build financial dashboards with automated data refresh to track portfolio performance and market signals.
Tableau views: Candlestick-style price charts, earnings surprise bar charts, sector rotation dashboards.
6. Supply chain monitoring
Track product availability, shipping estimates, seller inventory levels, and pricing across global marketplaces. Operations teams build Tableau dashboards that detect supply disruptions, like sudden stock-outs or delivery time spikes, before they affect the rest of the supply chain.
Tableau views: Availability status matrices, delivery time trend lines, supplier risk scorecards.
Each of these use cases follows the same architecture: Bright Data API → Structured Data → Tableau Dashboard. The only things that change are the dataset ID and the Tableau visualizations you build.
How the Bright Data API pipeline works
The tutorial script handles triggering and polling. Here’s what happens across the full pipeline, from API call to Tableau dashboard.
Step-by-step data flow
- Trigger. Your Python script sends a POST request to Bright Data’s
/triggerendpoint. Include either a keyword (for discovery) or a list of URLs (for targeted collection). The API returns asnapshot_idimmediately. - Collection. Bright Data’s infrastructure routes requests through 400M+ residential proxies. It handles CAPTCHA challenges automatically, renders JavaScript where needed, and retries failed requests.
- Parsing. Bright Data parses raw HTML into structured data fields. For Amazon products, this can include title, price, rating, reviews, seller info, and availability – though the exact fields returned depend on the dataset and search type.
- Snapshot. Once collection and parsing are complete, Bright Data stores the data as a snapshot. Your script polls the
/snapshotendpoint until the status changes from202 (processing)to200 (ready). - Delivery. You fetch the snapshot as JSON or CSV. Alternatively, configure delivery to Amazon S3, Google Cloud Storage, Azure Blob, Snowflake, SFTP, or webhook. Automatic delivery is useful for production pipelines that store data in a warehouse.
- Transformation. Your script (or a tool like pandas) renames columns, filters fields, and formats the data for Tableau to read. This is where you add metadata columns like scrape date and data source.
- Visualization. Tableau reads the output file (or connects to a database if you’ve loaded the data there) and renders your dashboard with the most recent data.
Scaling the pipeline
For production use, consider these enhancements:
- Multiple keywords. Loop through a list of keywords or product categories in your script to build comprehensive datasets.
- Database storage. Instead of CSV, write to PostgreSQL or MySQL. Tableau connects natively to both, and historical data builds up over time for trend analysis.
- Orchestration. Use Apache Airflow, Prefect, or a cron job to schedule runs at the frequency your business requires (hourly, daily, weekly).
- Webhook delivery. Skip polling entirely by configuring Bright Data to POST results to your server when they’re ready.
Production checklist
Before deploying the pipeline to a production schedule, handle these operational concerns:
- Error handling. Wrap API calls in try/except blocks with retry logic. Log failures to a file or monitoring service so outdated data is detected early.
- Data deduplication. Append a unique key (such as ASIN + scrape date) and deduplicate before loading into Tableau. Duplicate rows distort aggregations.
- Schema validation. Verify that the API response contains expected fields before writing to CSV. Website changes can alter the data structure without warning.
- Monitoring and alerting. Set up alerts (email, Slack, or PagerDuty) for failed runs, empty datasets, or unexpected row count drops.
- Data backups. Archive each CSV snapshot with a timestamp. If a bad scrape corrupts your working file, roll back to the previous version.
Why Bright Data for Tableau pipelines
For production Tableau workflows, these factors matter:
- Flexible delivery. Get results as JSON, CSV, or NDJSON via API, webhook, Amazon S3, Google Cloud, Azure, or SFTP. Load data into your Tableau data warehouse.
- Custom or ready-made. Use Serverless Functions to create custom scrapers, Scraper Studio to create AI-powered and generated scrapers, or use ready-made datasets for instant access without writing code.
- Cost-effective. Pay $1.50 per 1,000 records on pay-as-you-go, with volume discounts down to $0.75/1K at higher tiers.
Build your live web data pipeline
The gap between available data and required data continues to grow, especially when that data lives on the open web with no API or connector.
WDC v2 is deprecated and unsupported. Google Sheets reaches cell limits. Excel requires manual work. TabPy lacks proxy rotation. DIY scripts break at scale.
Bright Data’s Web Scraper API provides the infrastructure layer that these approaches lack. The API includes 120+ ready-made scrapers, 400M+ proxies across 195 countries, automatic CAPTCHA solving, and structured data output in formats Tableau supports natively. Pricing starts at $1.50 per 1,000 records, with 99.99% uptime and full GDPR, CCPA, and ISO 27001 compliance.
Instead of building data collection infrastructure, focus on building dashboards.
Frequently asked questions
Is Tableau WDC deprecated?
Yes. Tableau’s Web Data Connector v2 was officially deprecated in the 2023.1 release. Tableau 2022.4, the last version to support WDC v2, has reached end-of-life. WDC v2 connectors are unsupported in all current Tableau versions and could be removed in any future update.
What replaced Tableau WDC?
Tableau released WDC v3, but it’s extract-only and not supported by Tableau Bridge. For live web data, a scraping API pipeline (Bright Data → CSV/JSON → Tableau) is a practical alternative. The tutorial in this guide builds that pipeline.
Can Tableau connect directly to a web scraping API?
Not natively. Tableau connects to databases, files, and specific cloud services. To use a scraping API, you need a lightweight script in Python or Node.js that calls the API and receives the data. The script then outputs a format Tableau reads: CSV, JSON, or a database insert.
How do I keep my Tableau dashboard data up to date?
Schedule your data collection script using cron (Linux/Mac), Task Scheduler (Windows), or a workflow orchestrator like Apache Airflow. The script pulls the latest data from Bright Data’s API and overwrites the CSV file. Tableau loads the updated data on its next refresh cycle.
How much does it cost to load web data into Tableau?
Bright Data’s Web Scraper API starts at $1.50 per 1,000 records on pay-as-you-go, with volume discounts down to $0.75/1K. For a typical competitor monitoring dashboard tracking 5,000 products daily, that’s approximately $7.50/day or ~$225/month.
What data formats does Bright Data output for Tableau?
Bright Data delivers data as JSON, CSV, or NDJSON via API. For Tableau, CSV is the most direct option. Tableau reads it natively with no transformation needed. Alternatively, configure automatic delivery to Amazon S3, Google Cloud Storage, Azure Blob, Snowflake, SFTP, or webhook for production pipelines.
Can I use Bright Data with Tableau Public?
Yes. Bright Data outputs standard CSV files that Tableau Public reads natively. The limitation is on Tableau Public’s side: it doesn’t support scheduled refreshes for file-based sources. You need to re-run your data collection script and re-publish the workbook each time the data updates.

Technical Writer
Satyam Tripathi helps SaaS and data startups turn complex tech into actionable content, boosting developer adoption and user understanding.