Financial markets generate massive amounts of data every second. NASDAQ stands as one of the world’s largest exchanges, hosting major companies like Apple, Microsoft, Tesla, and Amazon.
If you’re building trading algorithms, research dashboards, or fintech applications, collecting this financial data presents both significant opportunities and technical challenges. This guide walks through 3 proven methods for collecting financial data from NASDAQ: direct API access through internal endpoints, implementing enterprise proxy infrastructure for scale, and using AI-powered web scraping with MCP (Model Context Protocol).
Understanding the NASDAQ data landscape
NASDAQ provides comprehensive market data that’s perfect for research, backtesting, and analytical applications. Here’s what you can typically access:
- Price data – last trade price, daily high/low, opening/closing prices, trading volume and percentage changes for listed stocks
- Historical data – daily OHLC (Open, High, Low, Close) data, dividend histories, stock splits, and historical trading volumes
- Company information – basic company details, sector classifications, and links to SEC filings and company news
- Additional features – interactive charts, earnings calendars, and institutional holdings data
Traders and investors use backtesting to analyze the historical performance of strategies before implementing them in live trading. Businesses leverage this market data for competitive intelligence, helping them track competitor activity and identify market trends and opportunities. For more advanced scenarios, explore our comprehensive financial data use cases.
Now let’s see how to scrape this data.
Data extraction methodology
Modern financial sites like NASDAQ, yahoo finance, and google finance are built as single-page applications that use JavaScript to render dynamic content. Instead of parsing brittle HTML, it’s more robust to call their internal JSON API endpoints directly, since JSON responses are cleaner and more stable.
Here’s how to identify NASDAQ’s JSON endpoints:
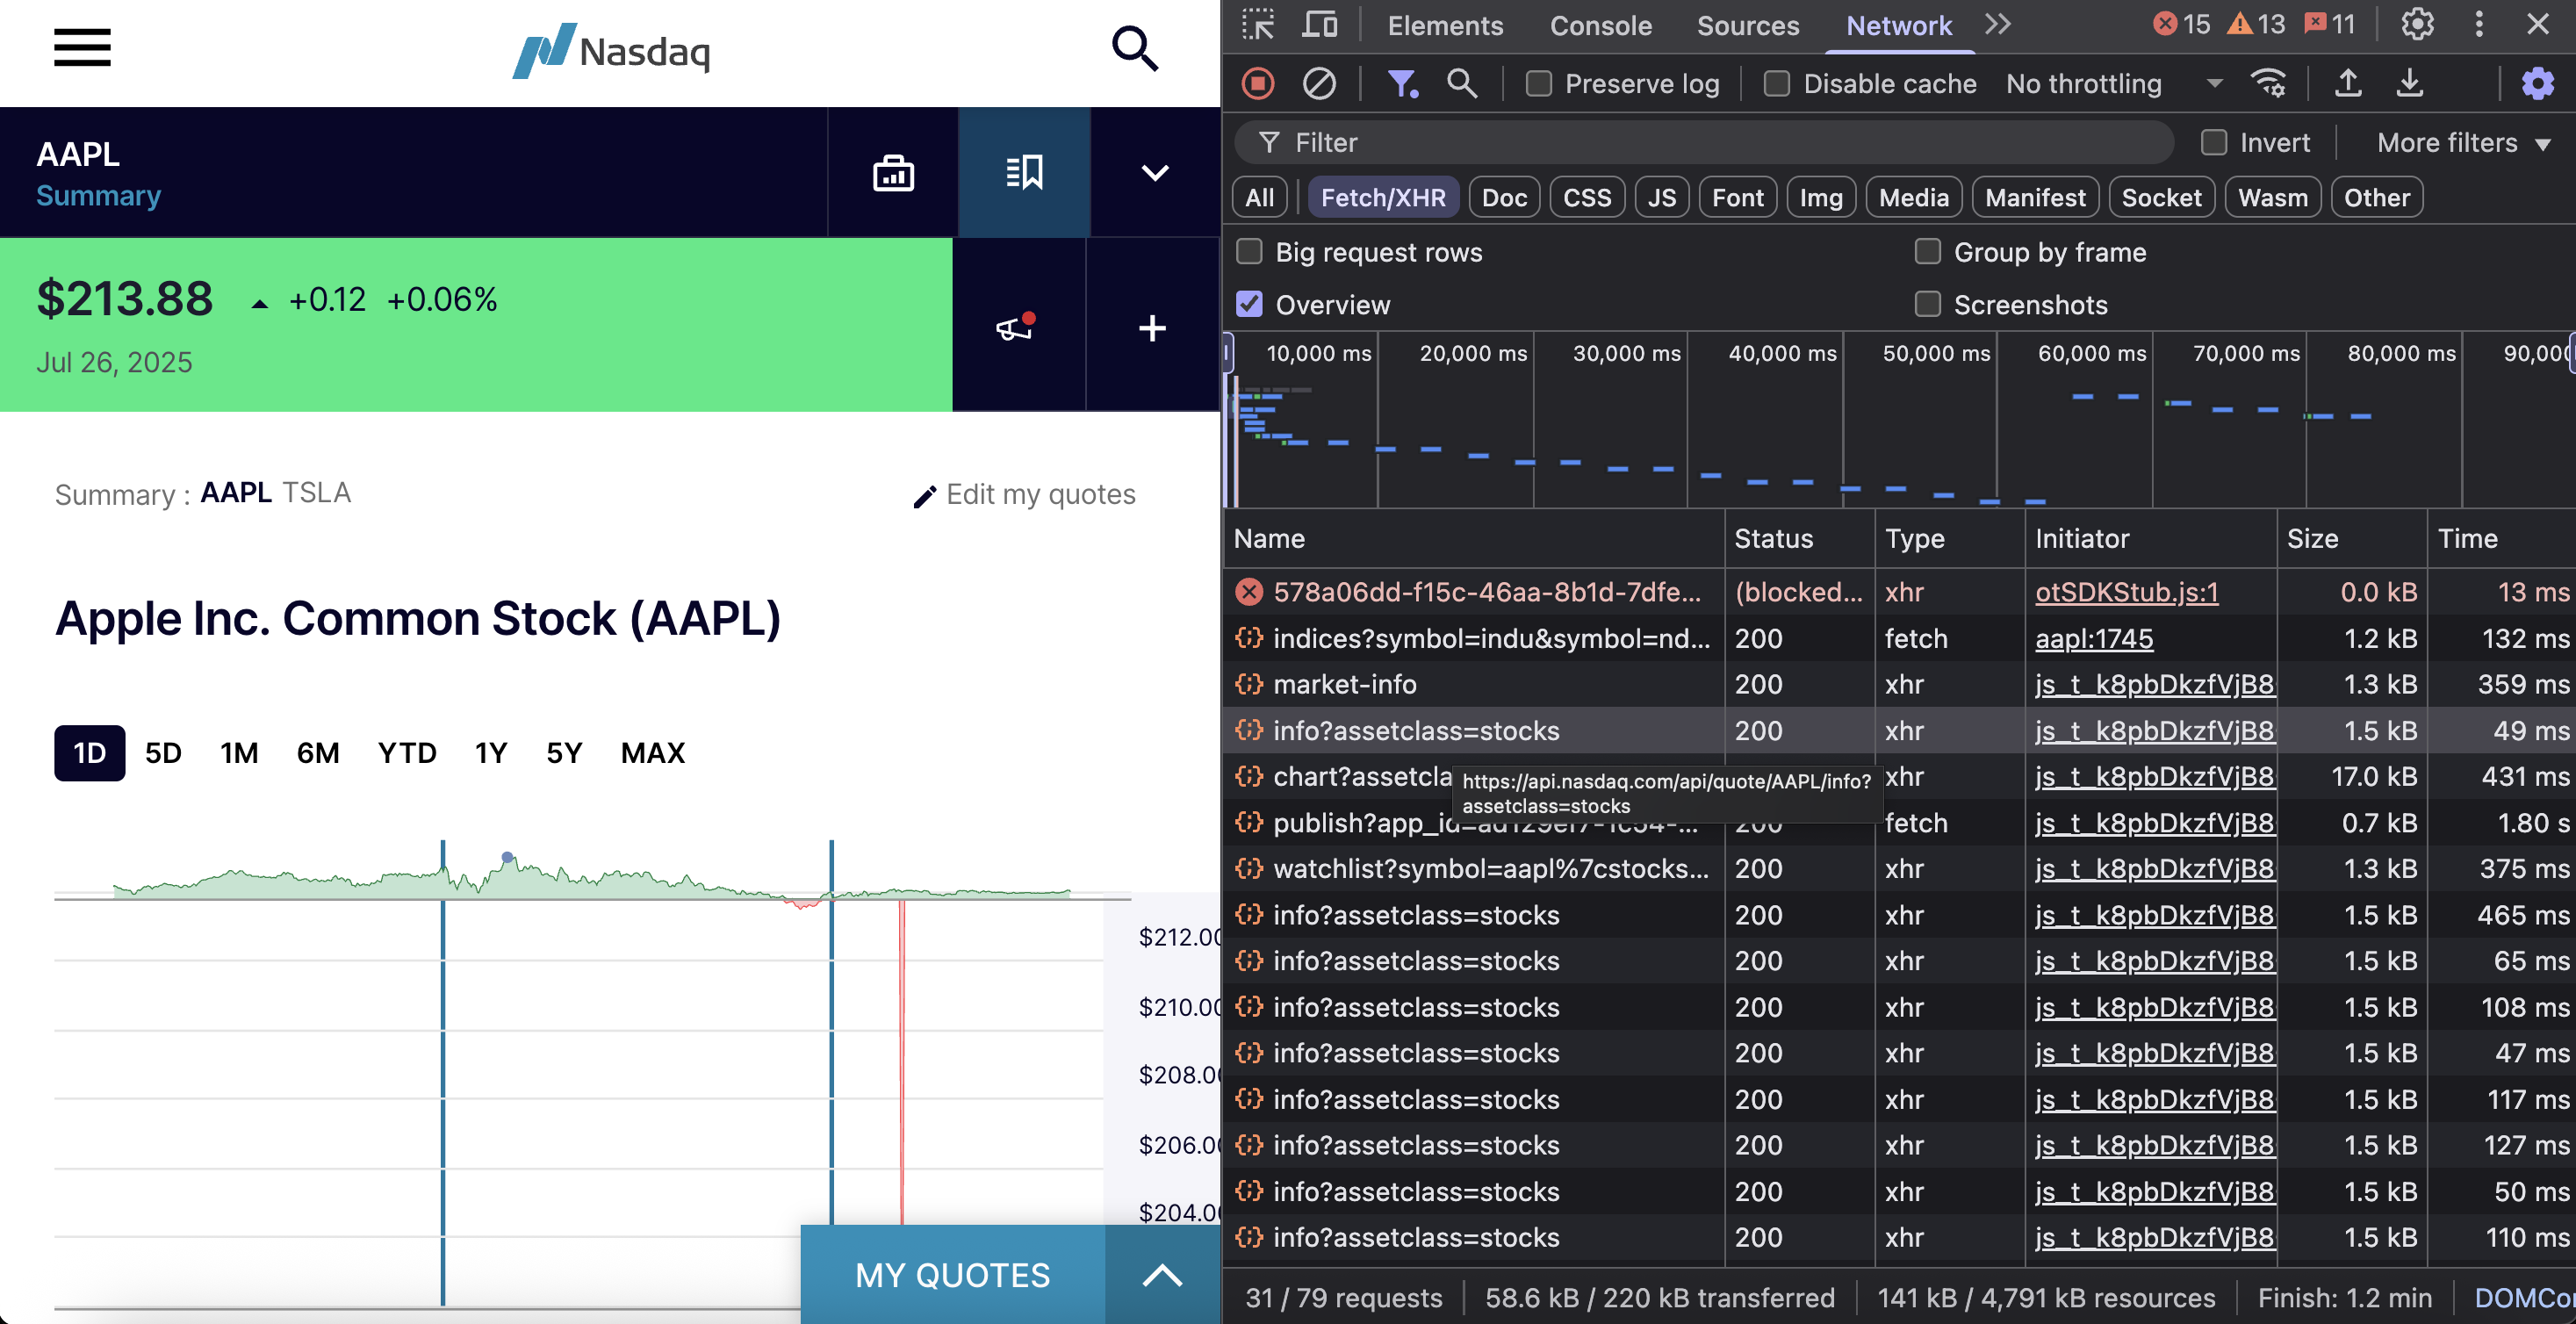
- Open any ticker page (e.g., https://www.nasdaq.com/market-activity/stocks/aapl) and open your browser’s Developer Tools.
- In the Network tab, select the Fetch/XHR filter to isolate API traffic.
- Reload the page to capture all the requests.
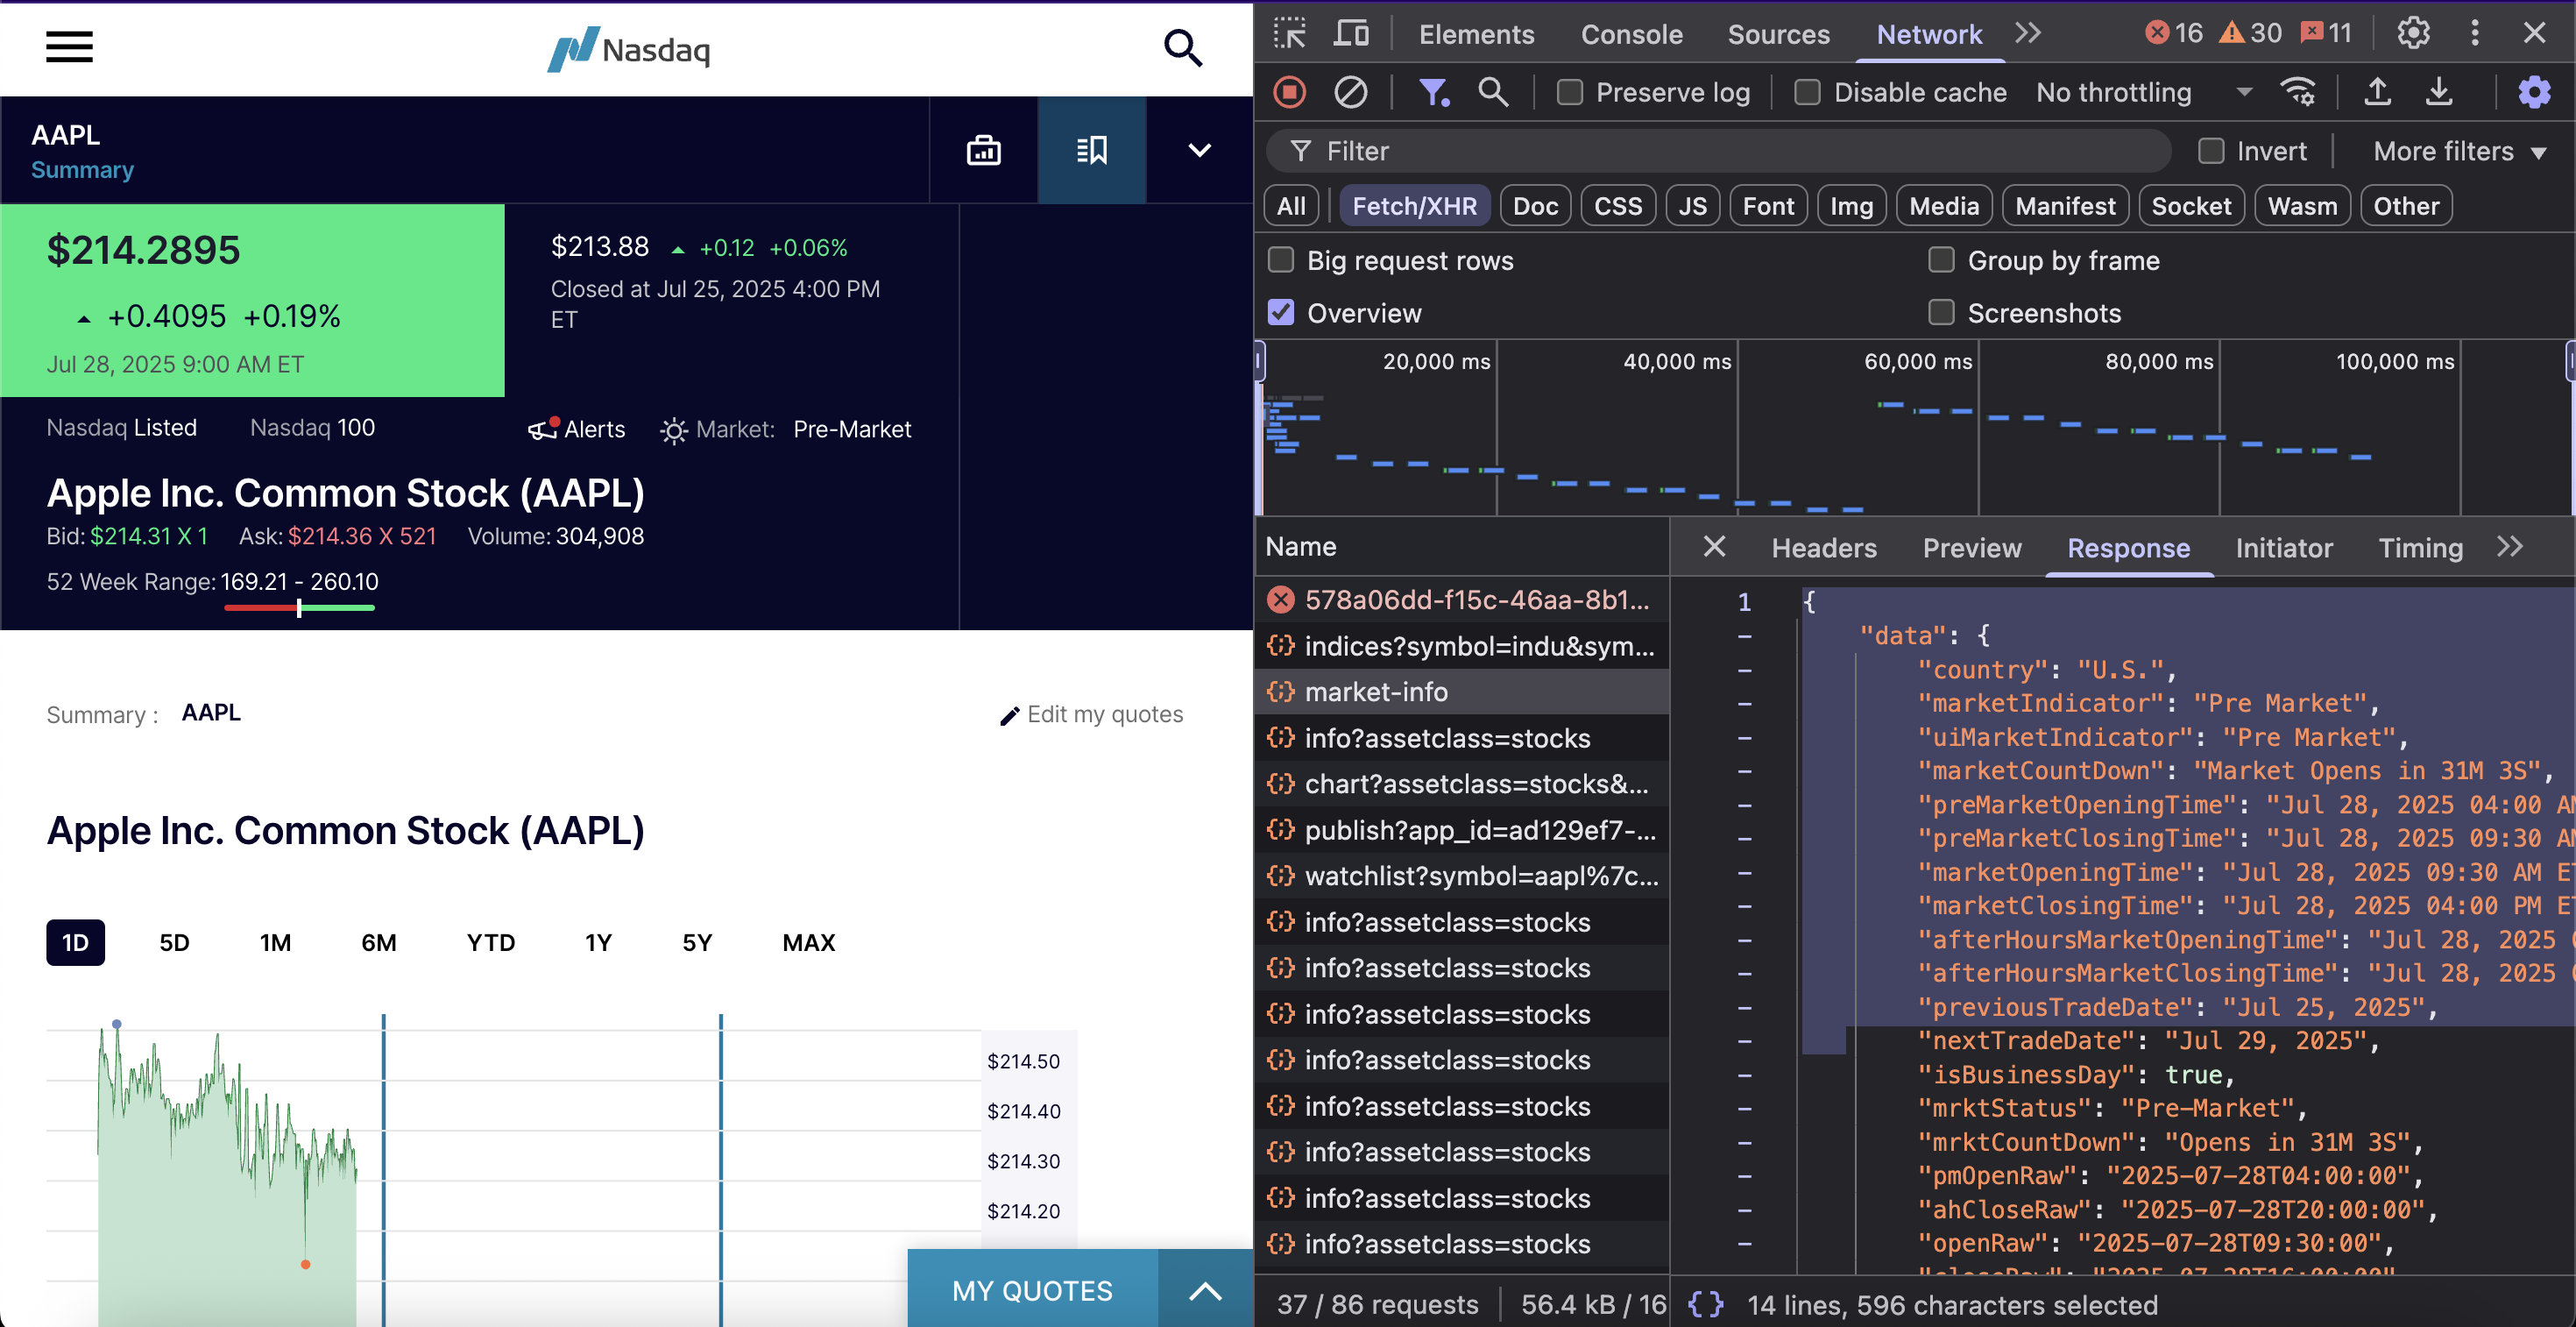
After reloading, you’ll see requests like market-info, chart, watchlist, and several others.
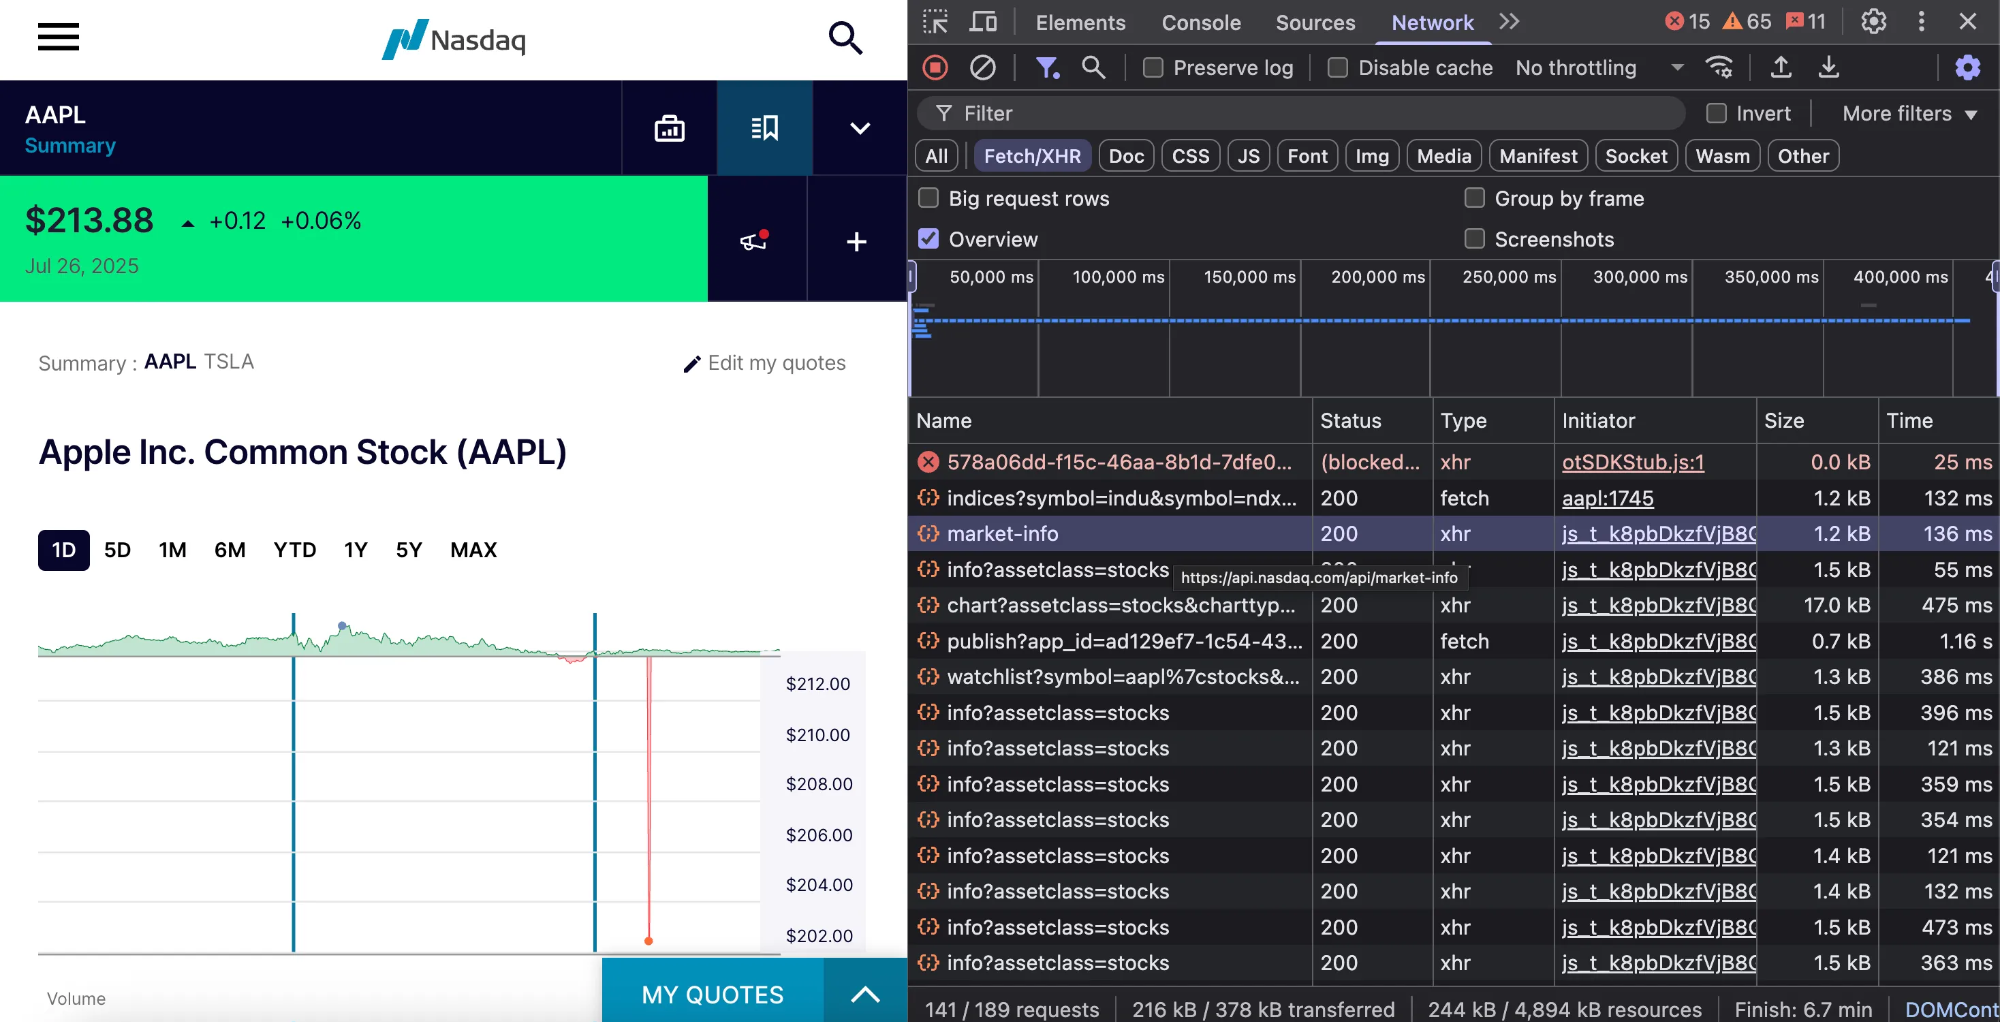
Click any request to inspect the JSON payload, the market-info request, for example, displays a comprehensive data structure with real-time market information.
With these endpoints identified, let’s set up the required tools.
Prerequisites
- Python 3.x
- A code editor (VS Code, PyCharm, etc.)
- Basic familiarity with Chrome Developer Tools
- Understanding of Python scraping basics and data extraction libraries
- The
requestslibrary. Install it using the commandpip install requests
If you’re new to the requests library, our Python requests guide covers all the techniques we’ll use in this tutorial.
With these tools ready, let’s explore the first method.
Method 1 – web scraping with direct API access
The key endpoints we’ll use provide comprehensive market data through clean JSON responses.
Market status and trading schedule
This endpoint returns U.S. market status with countdown information and complete trading schedules. It covers regular hours, pre-market, and after-hours sessions, providing previous and next trading dates in multiple timestamp formats for easy integration.
The endpoint is https://api.nasdaq.com/api/market-info.
Here’s a simple implementation:
import requests

headers = {
    'accept': 'application/json',
    'user-agent': 'Mozilla/5.0 (Macintosh; Intel Mac OS X 10_15_7) AppleWebKit/537.36 (KHTML, like Gecko) Chrome/138.0.0.0 Safari/537.36',
}

response = requests.get('https://api.nasdaq.com/api/market-info', headers=headers)

print(response.json())
The API returns market status data like this:
{
  "data": {
    "country": "U.S.",
    "marketIndicator": "Market Open",
    "uiMarketIndicator": "Market Open",
    "marketCountDown": "Market Closes in 3H 7M",
    "preMarketOpeningTime": "Jul 29, 2026 04:00 AM ET",
    "preMarketClosingTime": "Jul 29, 2026 09:30 AM ET",
    "marketOpeningTime": "Jul 29, 2026 09:30 AM ET",
    "marketClosingTime": "Jul 29, 2026 04:00 PM ET",
    "afterHoursMarketOpeningTime": "Jul 29, 2026 04:00 PM ET",
    "afterHoursMarketClosingTime": "Jul 29, 2026 08:00 PM ET",
    "previousTradeDate": "Jul 28, 2026",
    "nextTradeDate": "Jul 30, 2026",
    "isBusinessDay": true,
    "mrktStatus": "Open",
    "mrktCountDown": "Closes in 3H 7M",
    "pmOpenRaw": "2026-07-29T04:00:00",
    "ahCloseRaw": "2026-07-29T20:00:00",
    "openRaw": "2026-07-29T09:30:00",
    "closeRaw": "2026-07-29T16:00:00"
  }
}
Great! This shows the API approach for retrieving real-time market timing data.
Stock quote data
NASDAQ’s quote endpoint provides detailed stock data for any publicly traded company, including the latest pricing, trading volume, company info, and market statistics.
The endpoint is https://api.nasdaq.com/api/quote/{symbol}/info?assetclass=stocks. It requires the stock ticker symbol (AAPL, TSLA) and assetclass set to stocks for equity data.
Here’s the simple code snippet:
import requests

def get_stock_info(symbol, headers):
    url = f'https://api.nasdaq.com/api/quote/{symbol}/info?assetclass=stocks'
    response = requests.get(url, headers=headers)
    return response.json()

headers = {
    'accept': 'application/json',
    'user-agent': 'Mozilla/5.0 (Macintosh; Intel Mac OS X 10_15_7) AppleWebKit/537.36 (KHTML, like Gecko) Chrome/138.0.0.0 Safari/537.36',
}
stock_info = get_stock_info('AAPL', headers)

print(stock_info)
The API returns stock quote data like this:
{
"data": {
"symbol": "AAPL",
"companyName": "Apple Inc. Common Stock",
"stockType": "Common Stock",
"exchange": "NASDAQ-GS",
"isNasdaqListed": true,
"isNasdaq100": true,
"isHeld": false,
"primaryData": {
"lastSalePrice": "$211.9388",
"netChange": "-2.1112",
"percentageChange": "-0.99%",
"deltaIndicator": "down",
"lastTradeTimestamp": "Jul 29, 2026 12:51 PM ET",
"isRealTime": true,
"bidPrice": "$211.93",
"askPrice": "$211.94",
"bidSize": "112",
"askSize": "235",
"volume": "23,153,569",
"currency": null
},
"secondaryData": null,
"marketStatus": "Open",
"assetClass": "STOCKS",
"keyStats": {
"fiftyTwoWeekHighLow": {
"label": "52 Week Range:",
"value": "169.21 - 260.10"
},
"dayrange": {
"label": "High/Low:",
"value": "211.51 - 214.81"
}
},
"notifications": [
{
"headline": "UPCOMING EVENTS",
"eventTypes": [
{
"message": "Earnings Date : Jul 31, 2026",
"eventName": "Earnings Date",
"url": {
"label": "AAPL Earnings Date : Jul 31, 2026",
"value": "/market-activity/stocks/AAPL/earnings"
},
"id": "upcoming_events"
}
]
}
]
}
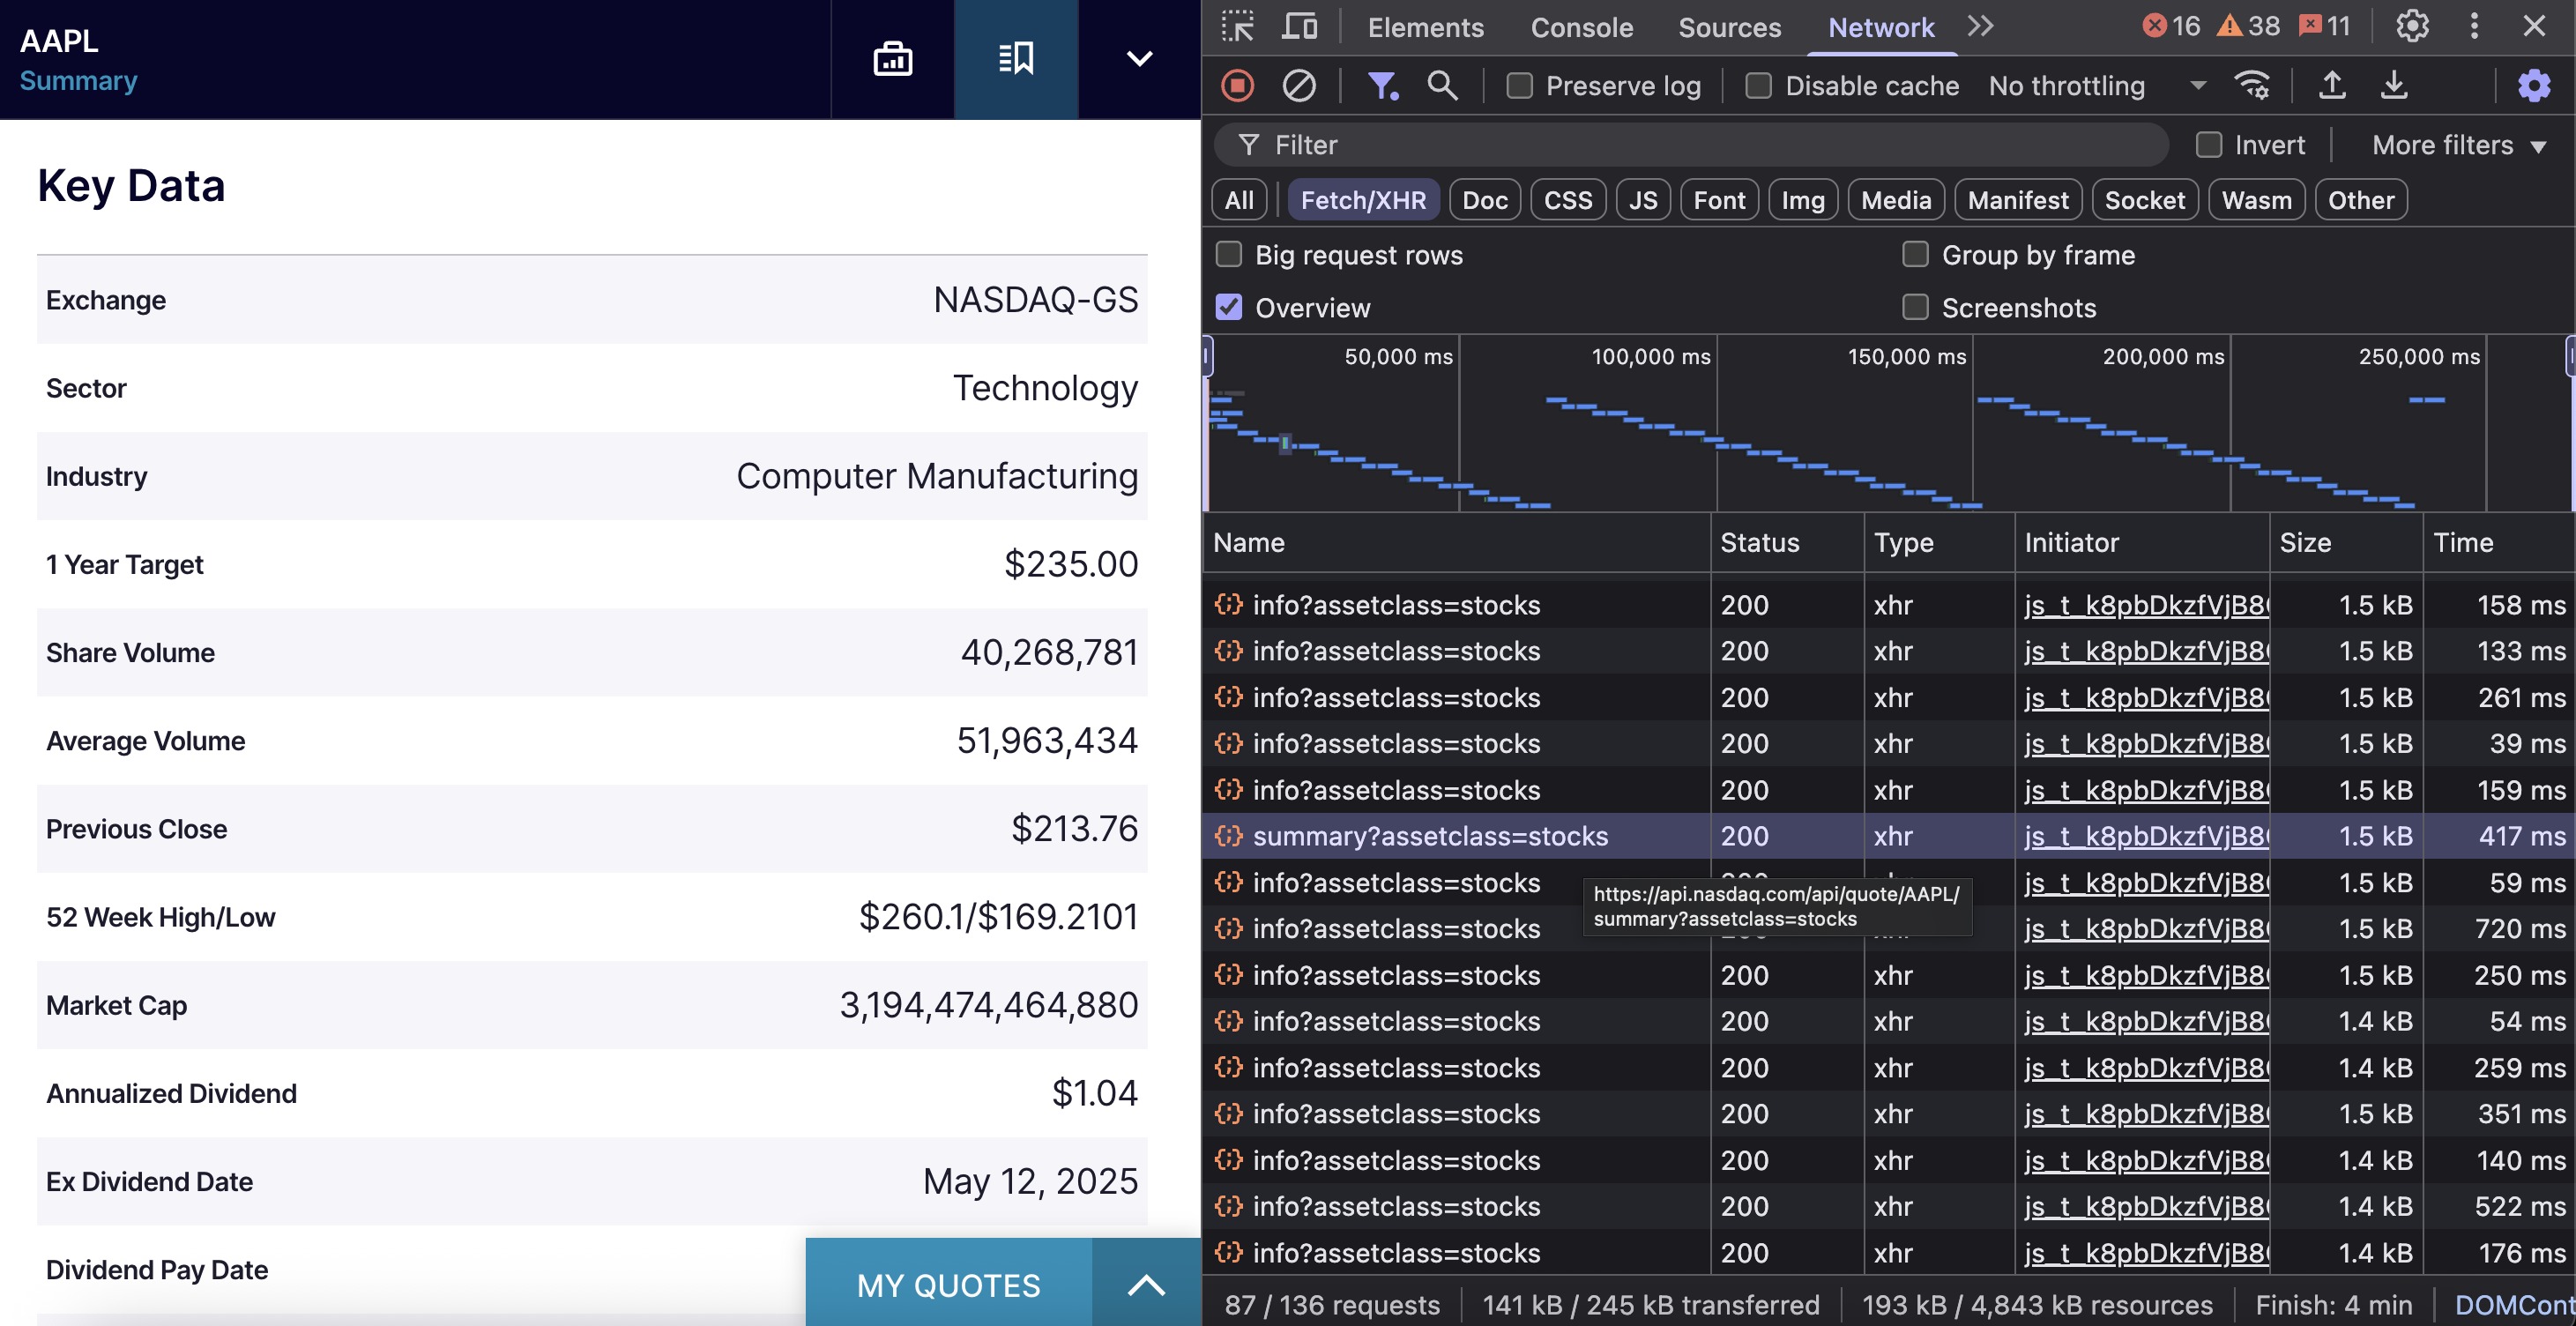
}Company fundamentals and key metrics
NASDAQ’s summary API provides key financial data, including market cap, trading volume, dividend information, and sector classification for any stock symbol.
When you visit a NASDAQ company page and scroll to the “Key Data” section, your browser calls a specific endpoint. This endpoint is https://api.nasdaq.com/api/quote/{SYMBOL}/summary?assetclass=stocks and contains all the company’s fundamental data.
Here’s the code snippet:
import requests

def get_company_data(symbol, headers):
    url = f'https://api.nasdaq.com/api/quote/{symbol}/summary?assetclass=stocks'
    response = requests.get(url, headers=headers)
    return response.json()

headers = {
    'accept': 'application/json',
    'user-agent': 'Mozilla/5.0 (Macintosh; Intel Mac OS X 10_15_7) AppleWebKit/537.36 (KHTML, like Gecko) Chrome/138.0.0.0 Safari/537.36',
}
company_data = get_company_data('AAPL', headers)

print(company_data)
The API returns company key data like this:
{
  "data": {
    "symbol": "AAPL",
    "summaryData": {
      "Exchange": {
        "label": "Exchange",
        "value": "NASDAQ-GS"
      },
      "Sector": {
        "label": "Sector",
        "value": "Technology"
      },
      "Industry": {
        "label": "Industry",
        "value": "Computer Manufacturing"
      },
      "OneYrTarget": {
        "label": "1 Year Target",
        "value": "$235.00"
      },
      "TodayHighLow": {
        "label": "Today's High/Low",
        "value": "$214.81/$210.825"
      },
      "ShareVolume": {
        "label": "Share Volume",
        "value": "25,159,852"
      },
      "AverageVolume": {
        "label": "Average Volume",
        "value": "51,507,684"
      },
      "PreviousClose": {
        "label": "Previous Close",
        "value": "$214.05"
      },
      "FiftTwoWeekHighLow": {
        "label": "52 Week High/Low",
        "value": "$260.1/$169.2101"
      },
      "MarketCap": {
        "label": "Market Cap",
        "value": "3,162,213,080,720"
      },
      "AnnualizedDividend": {
        "label": "Annualized Dividend",
        "value": "$1.04"
      },
      "ExDividendDate": {
        "label": "Ex Dividend Date",
        "value": "May 12, 2026"
      },
      "DividendPaymentDate": {
        "label": "Dividend Pay Date",
        "value": "May 15, 2026"
      },
      "Yield": {
        "label": "Current Yield",
        "value": "0.49%"
      }
    },
    "assetClass": "STOCKS",
    "additionalData": null,
    "bidAsk": {
      "Bid * Size": {
        "label": "Bid * Size",
        "value": "$211.75 * 280"
      },
      "Ask * Size": {
        "label": "Ask * Size",
        "value": "$211.79 * 225"
      }
    }
  }
}
NASDAQ chart and historical data
NASDAQ provides chart data through specialized endpoints designed for different timeframes and data granularity.
NASDAQ splits chart data across endpoints based on timeframe requirements:
- Intraday endpoint – minute-by-minute data for 1D and 5D timeframes.
- Historical endpoint – daily OHLC data for 1M, 6M, YTD, 1Y, 5Y, and MAX timeframes.
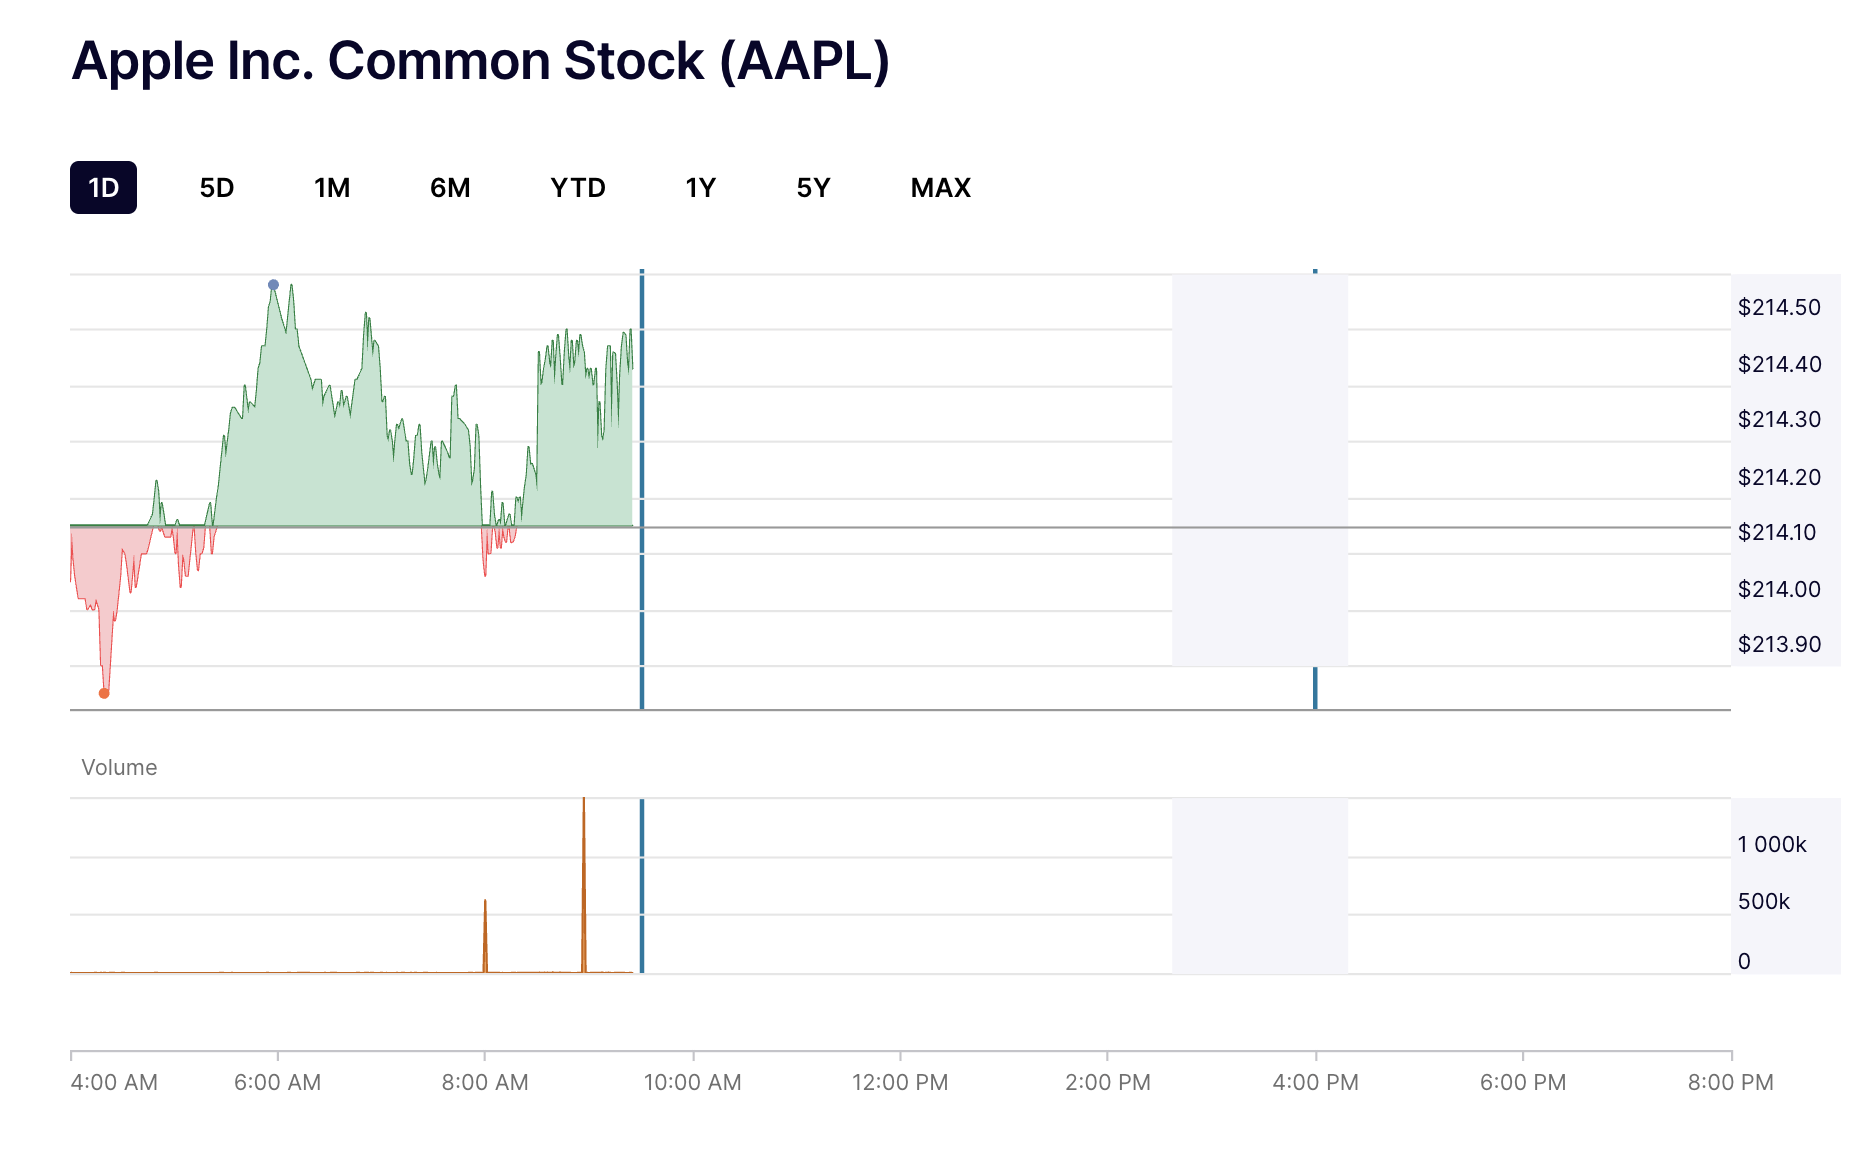
Intraday chart data (1D timeframe)
This endpoint is perfect for analyzing minute-by-minute price movements during trading sessions.
The endpoint is https://api.nasdaq.com/api/quote/{symbol}/chart?assetclass=stocks&charttype=rs.
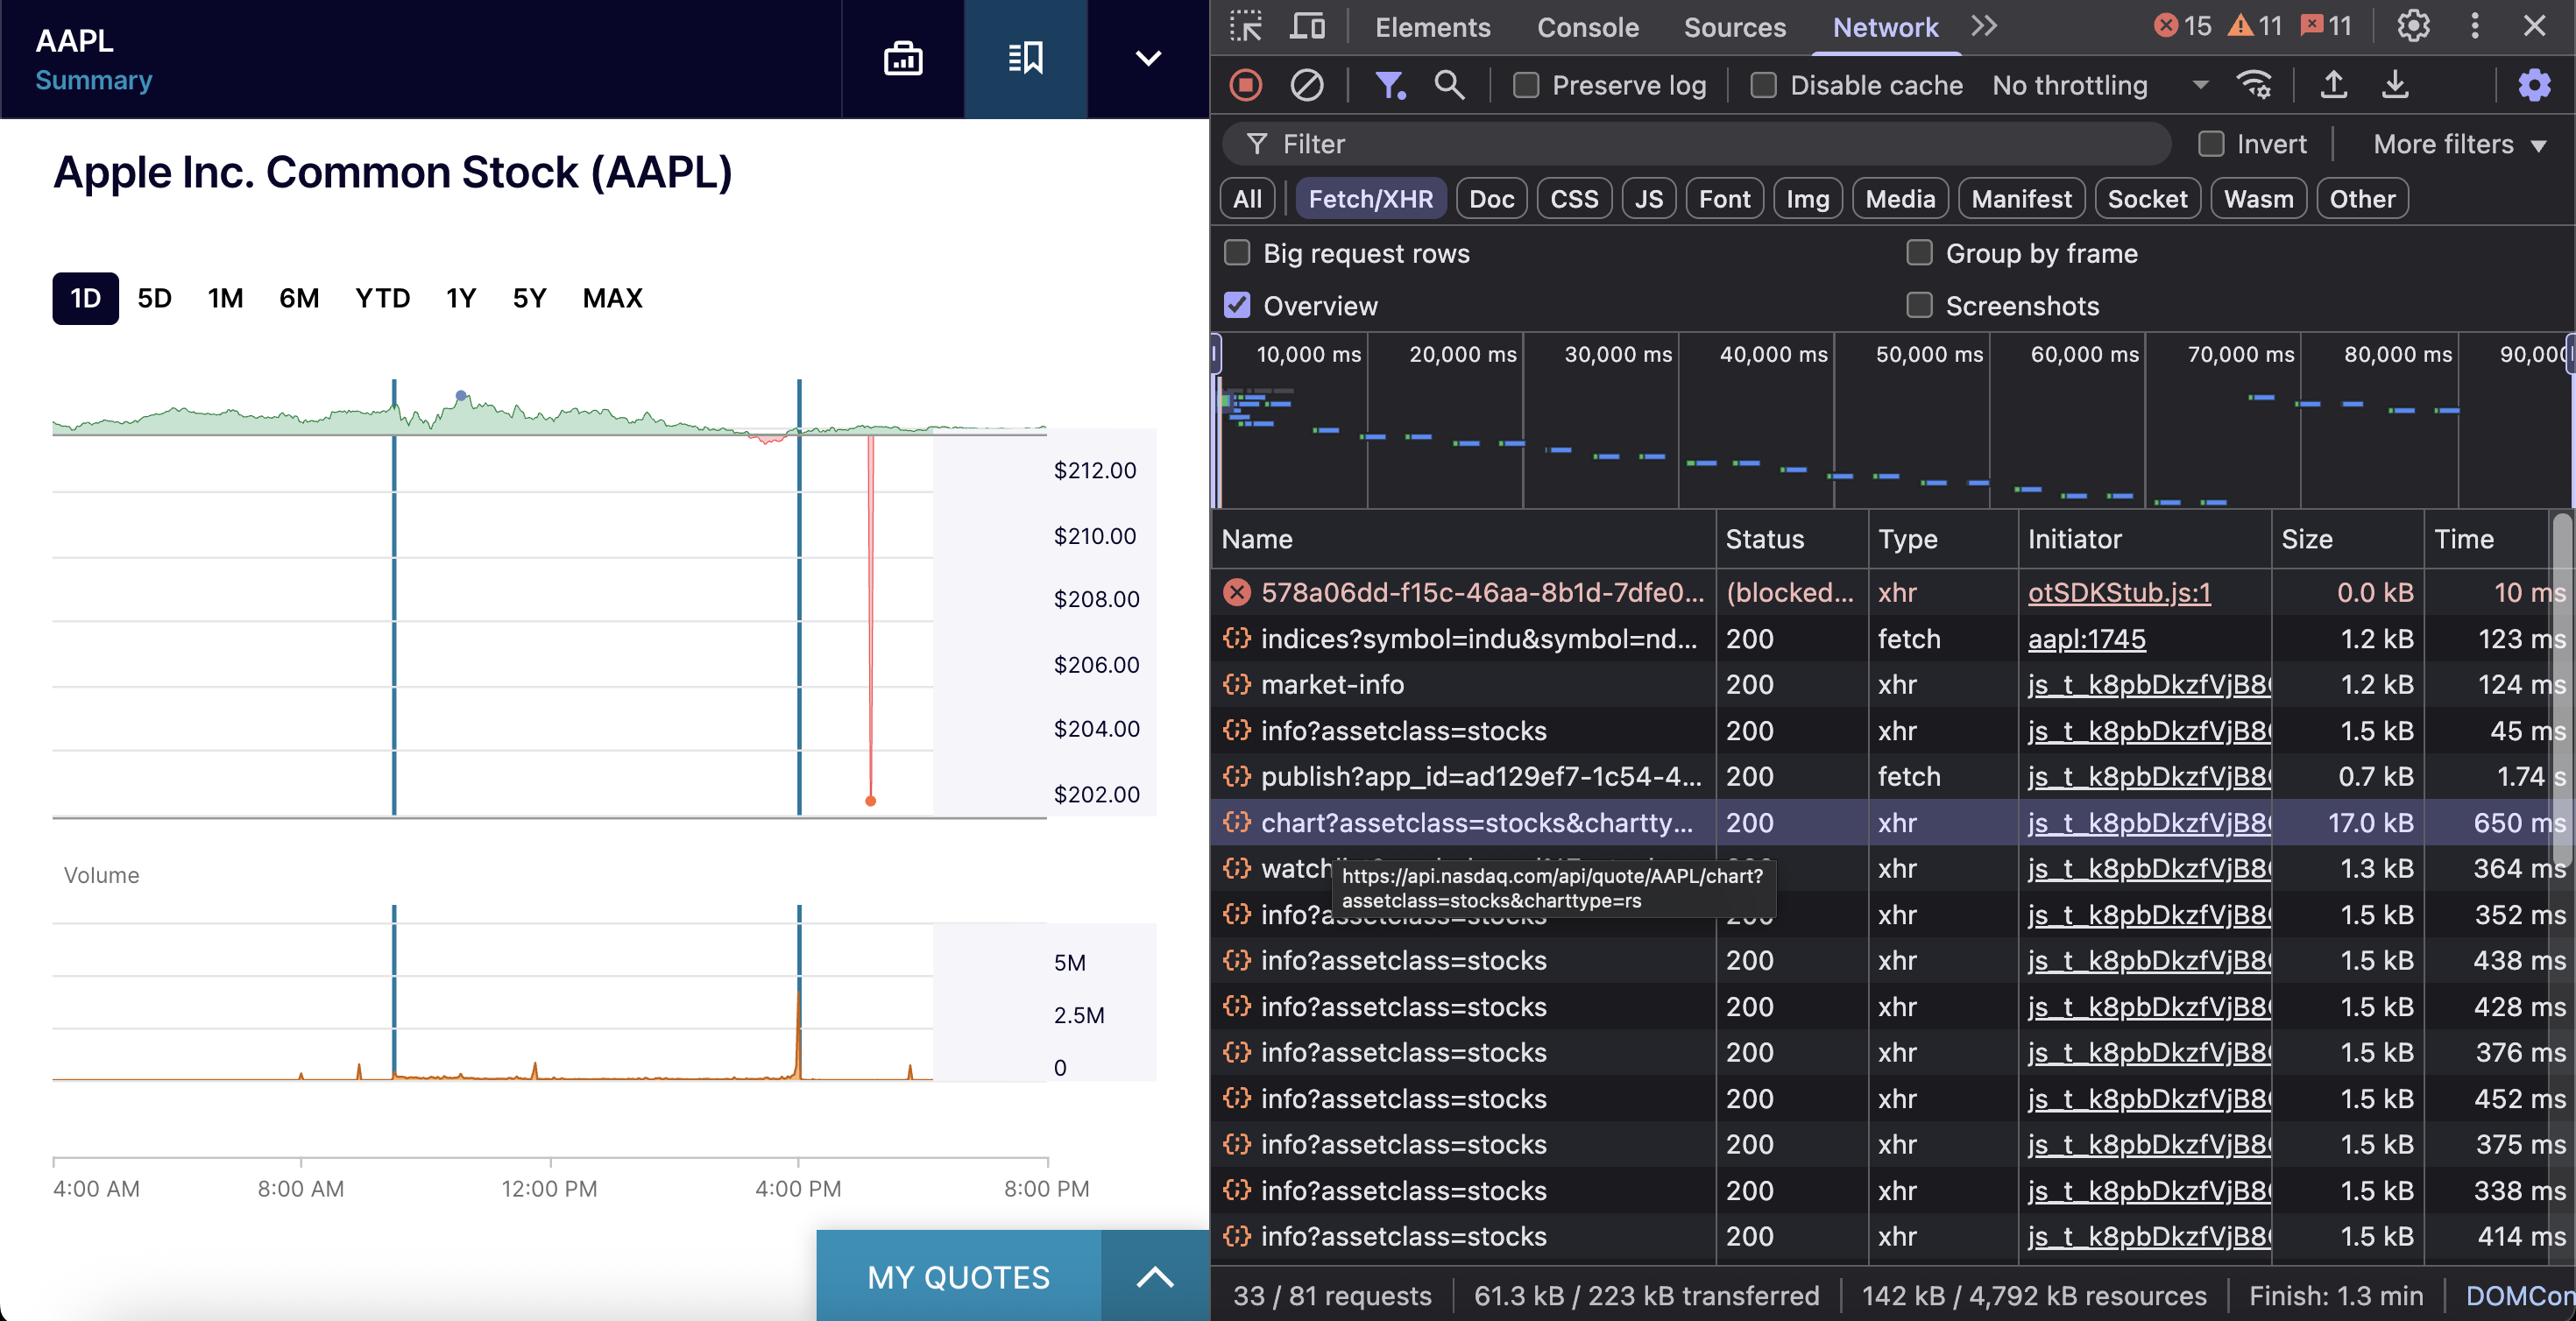
The endpoint requires three parameters: the stock ticker symbol, assetclass set to stocks for equity data, and charttype=rs for regular trading hours.
Here’s a simple implementation:
import requests

def get_chart_data(symbol, headers):
    url = f'https://api.nasdaq.com/api/quote/{symbol}/chart?assetclass=stocks&charttype=rs'
    response = requests.get(url, headers=headers)
    return response.json()

headers = {
    'accept': 'application/json',
    'user-agent': 'Mozilla/5.0 (Macintosh; Intel Mac OS X 10_15_7) AppleWebKit/537.36 (KHTML, like Gecko) Chrome/138.0.0.0 Safari/537.36',
}
chart_data = get_chart_data('AAPL', headers)

print(chart_data)
The API returns a company’s intraday data in the following structure:
{
    "data": {
        "chart": [
            {
                "w": 995,                    // Trading volume for this minute
                "x": 1753416000000,          // Timestamp (milliseconds)
                "y": 214.05,                 // Price
                "z": {                       // Human-readable format
                    "time": "4:00 AM",
                    "shares": "995",
                    "price": "$214.05",
                    "prevCls": "213.7600"    // Previous day's close
                }
            }
        ]
    }
}
For 5-day minute data, you need to use a different endpoint:
https://charting.nasdaq.com/data/charting/intraday?symbol=AAPL&mostRecent=5&includeLatestIntradayData=1This returns data structured like this (trimmed for brevity):
{
    "companyName": "APPLE INC",
    "marketData": [
        {
            "Date": "2026-07-22 09:30:00",
            "Value": 212.639999,
            "Volume": 2650933
        },
        {
            "Date": "2026-07-22 09:31:00",
            "Value": 212.577103,
            "Volume": 232676
        }
    ],
    "latestIntradayData": {
        "Date": "2026-07-28 16:00:00",
        "High": 214.845001,
        "Low": 213.059998,
        "Open": 214.029999,
        "Close": 214.050003,
        "Change": 0.169998,
        "PctChange": 0.079483,
        "Volume": 37858016
    }
}
Historical data (1M, 6M, YTD, 1Y, 5Y, MAX)
For longer timeframes, NASDAQ provides daily OHLC data through the historical endpoint.
The endpoint is https://charting.nasdaq.com/data/charting/historical?symbol={symbol}&date={start}~{end}&.
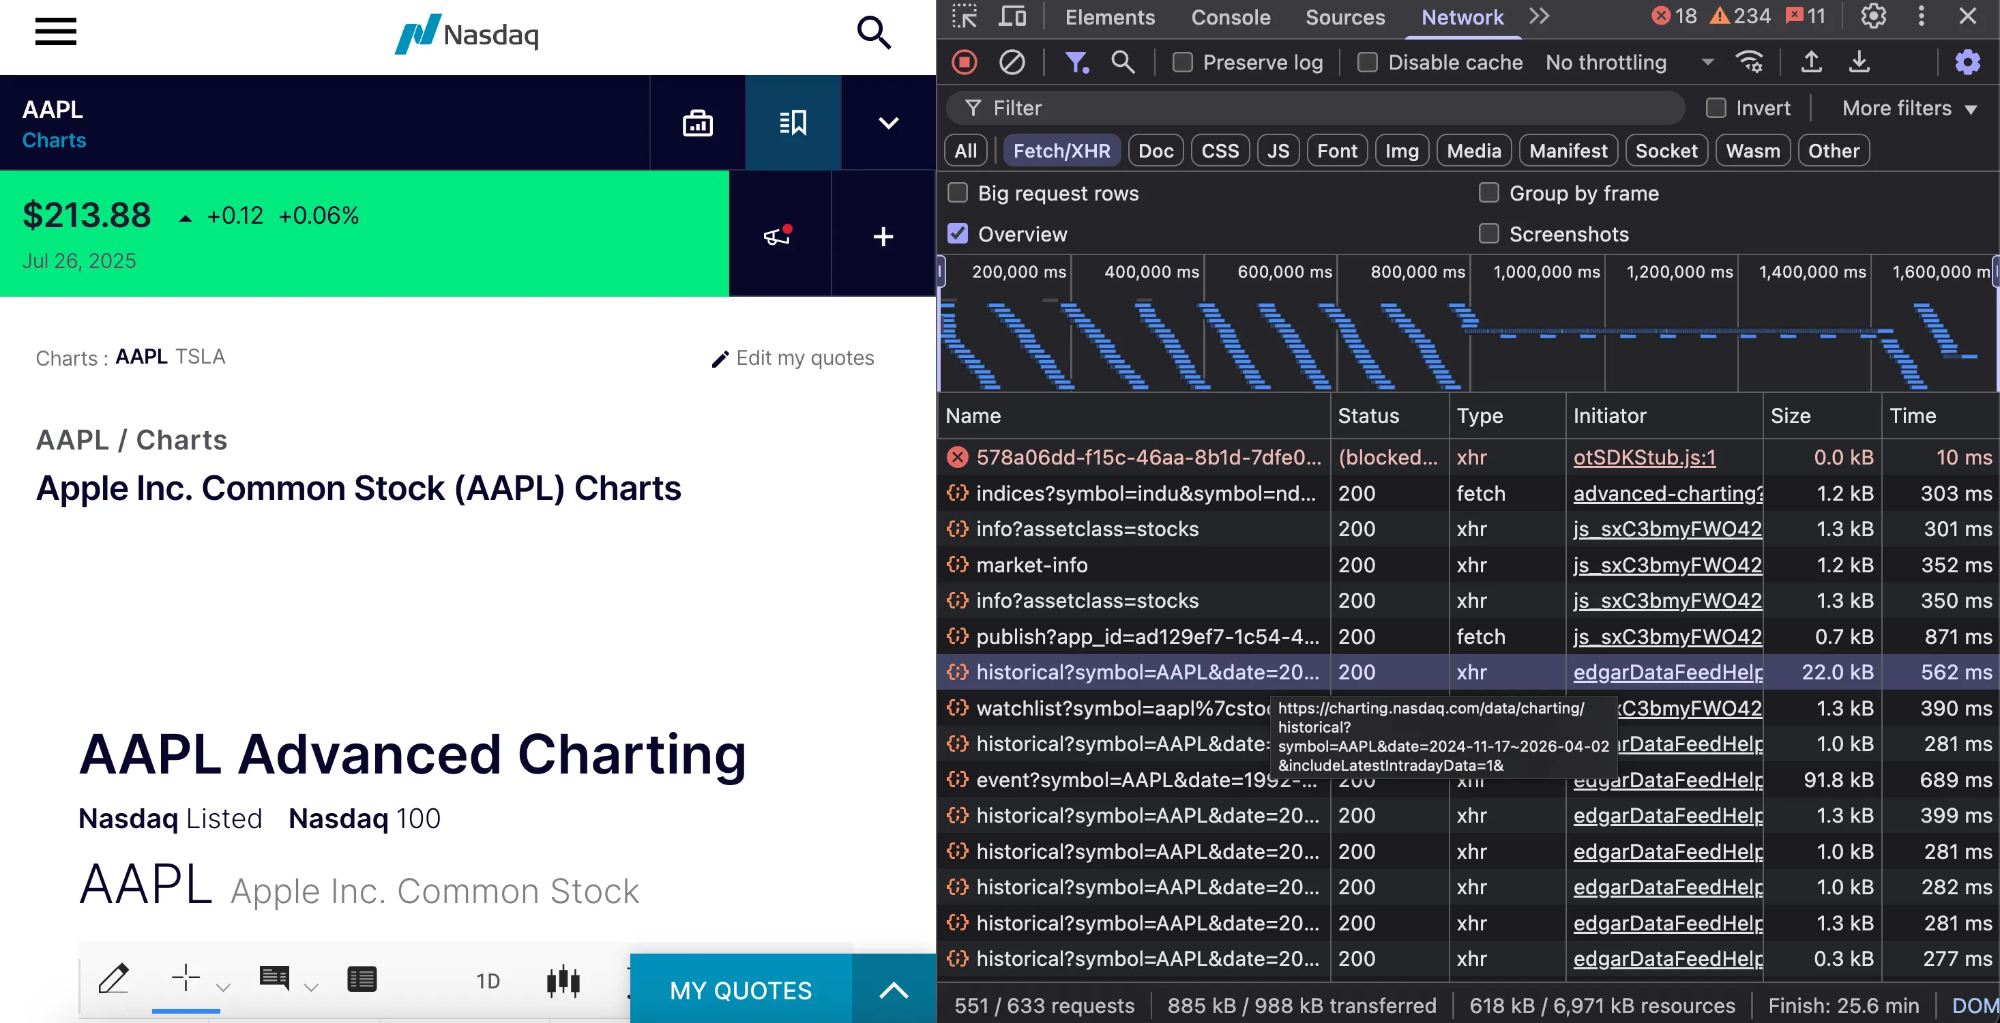
The endpoint requires the stock ticker symbol and date range in the format “YYYY-MM-DD~YYYY-MM-DD”.
Here’s the sample code:
import requests

def get_historical_data(symbol, headers):
    url = f"https://charting.nasdaq.com/data/charting/historical?symbol={symbol}&date=2024-08-24~2024-10-23&"
    response = requests.get(url, headers=headers)
    return response.json()

headers = {
    "accept": "*/*",
    "referer": "https://charting.nasdaq.com/dynamic/chart.html",
    "user-agent": "Mozilla/5.0 (Macintosh; Intel Mac OS X 10_15_7) AppleWebKit/537.36 (KHTML, like Gecko) Chrome/138.0.0.0 Safari/537.36",
}

historical_data = get_historical_data("AAPL", headers)

print(historical_data)
This returns data structured as follows (trimmed for brevity):
{
    "companyName": "APPLE INC",
    "marketData": [
        {
            "Date": "2024-11-18 00:00:00",
            "High": 229.740000,
            "Low": 225.170000,
            "Open": 225.250000,
            "Close": 228.020000,
            "Volume": 44686020
        }
    ],
    "latestIntradayData": {
        "Date": "2026-07-25 16:00:00",
        "High": 215.240005,
        "Low": 213.399994,
        "Open": 214.699997,
        "Close": 213.880005,
        "Change": 0.120010,
        "PctChange": 0.056143,
        "Volume": 40268780
    }
}
ETF holdings
The NASDAQ ETF Holdings API identifies Exchange-Traded Funds (ETFs) that include a specific stock among their top 10 holdings. This data shows institutional ownership patterns and helps identify related investment opportunities.
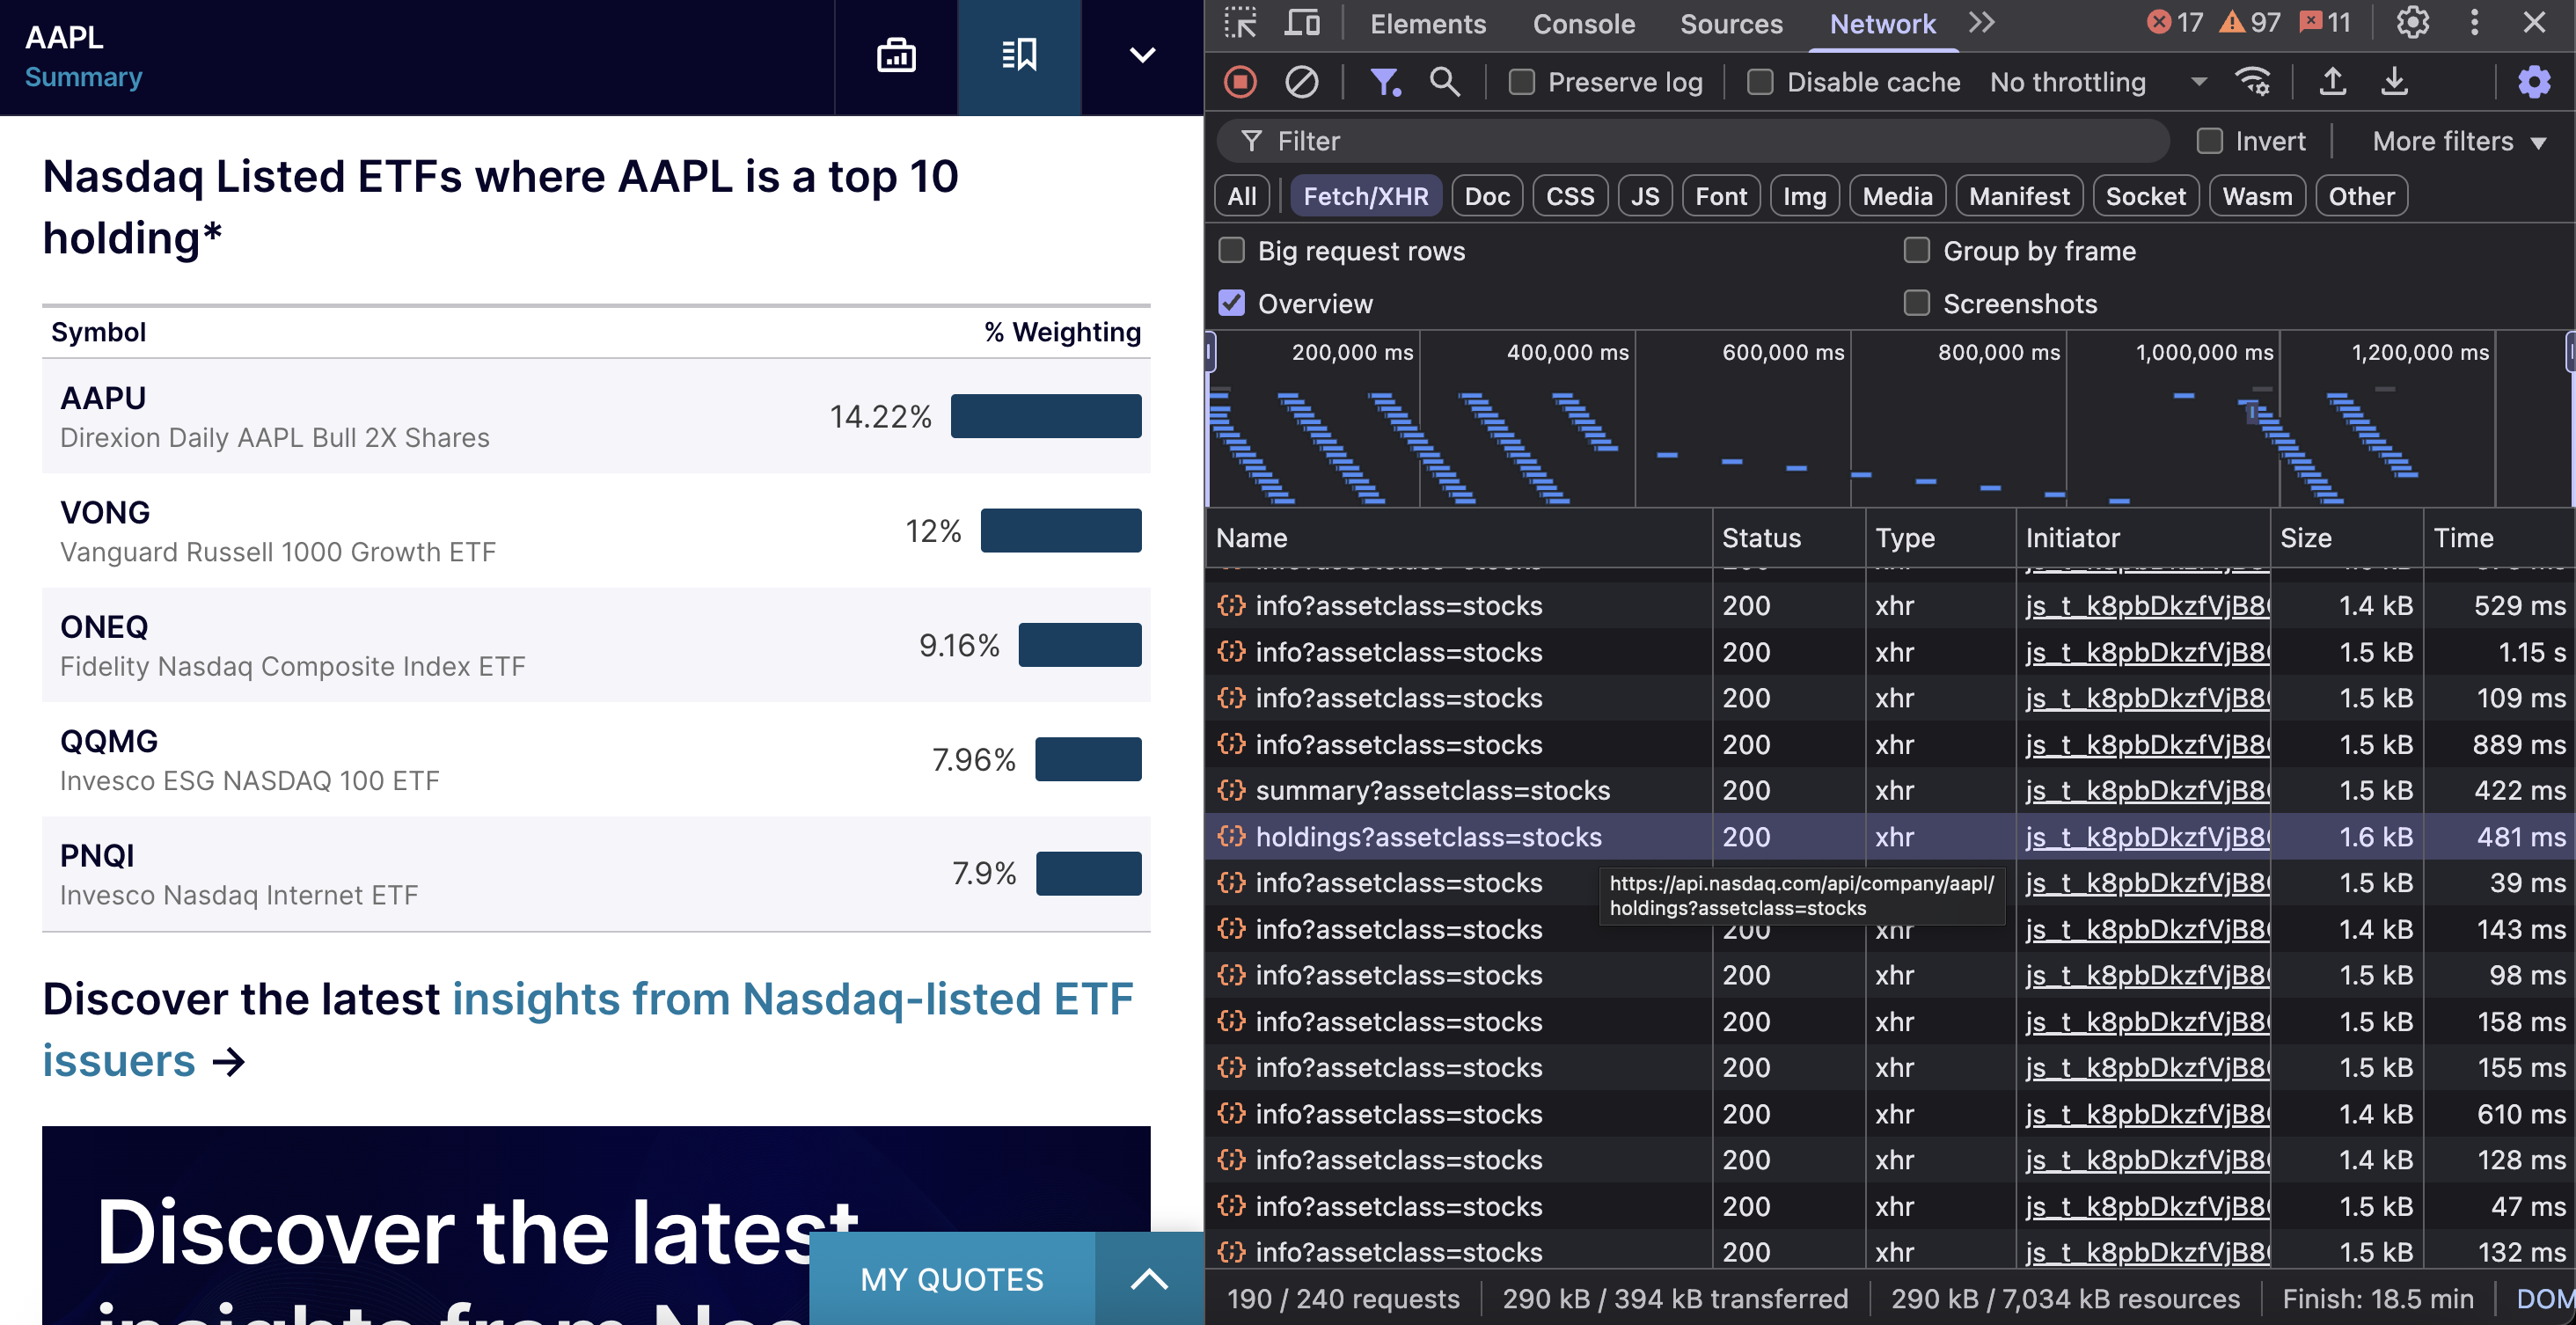
The endpoint is https://api.nasdaq.com/api/company/{symbol}/holdings?assetclass=stocks.
Here’s the implementation:
import requests

def get_holdings_data(symbol, headers):
    url = f'https://api.nasdaq.com/api/company/{symbol}/holdings?assetclass=stocks'
    response = requests.get(url, headers=headers)
    return response.json()

headers = {
    'accept': 'application/json',
    'user-agent': 'Mozilla/5.0 (Macintosh; Intel Mac OS X 10_15_7) AppleWebKit/537.36 (KHTML, like Gecko) Chrome/138.0.0.0 Safari/537.36',
}
holdings_data = get_holdings_data('AAPL', headers)

print(holdings_data)
The API returns two categories of ETF data: all ETFs that hold the stock as a top 10 position, and specifically NASDAQ-listed ETFs with the same criteria. The response includes weighting percentages, ETF performance data, and fund details.
{
    "data": {
        "heading": "ETFs with AAPL as a Top 10 Holding*",
        "holdings": { ... },           // All ETFs with the stock as top 10 holding
        "nasdaqheading": "Nasdaq Listed ETFs where AAPL is a top 10 holding*",
        "nasdaqHoldings": { ... }      // Specifically NASDAQ-listed ETFs
    }
}
Latest company news
This endpoint fetches recent news articles related to specific stock symbols. It provides detailed news coverage, including headlines, publication details, related symbols, and article metadata.
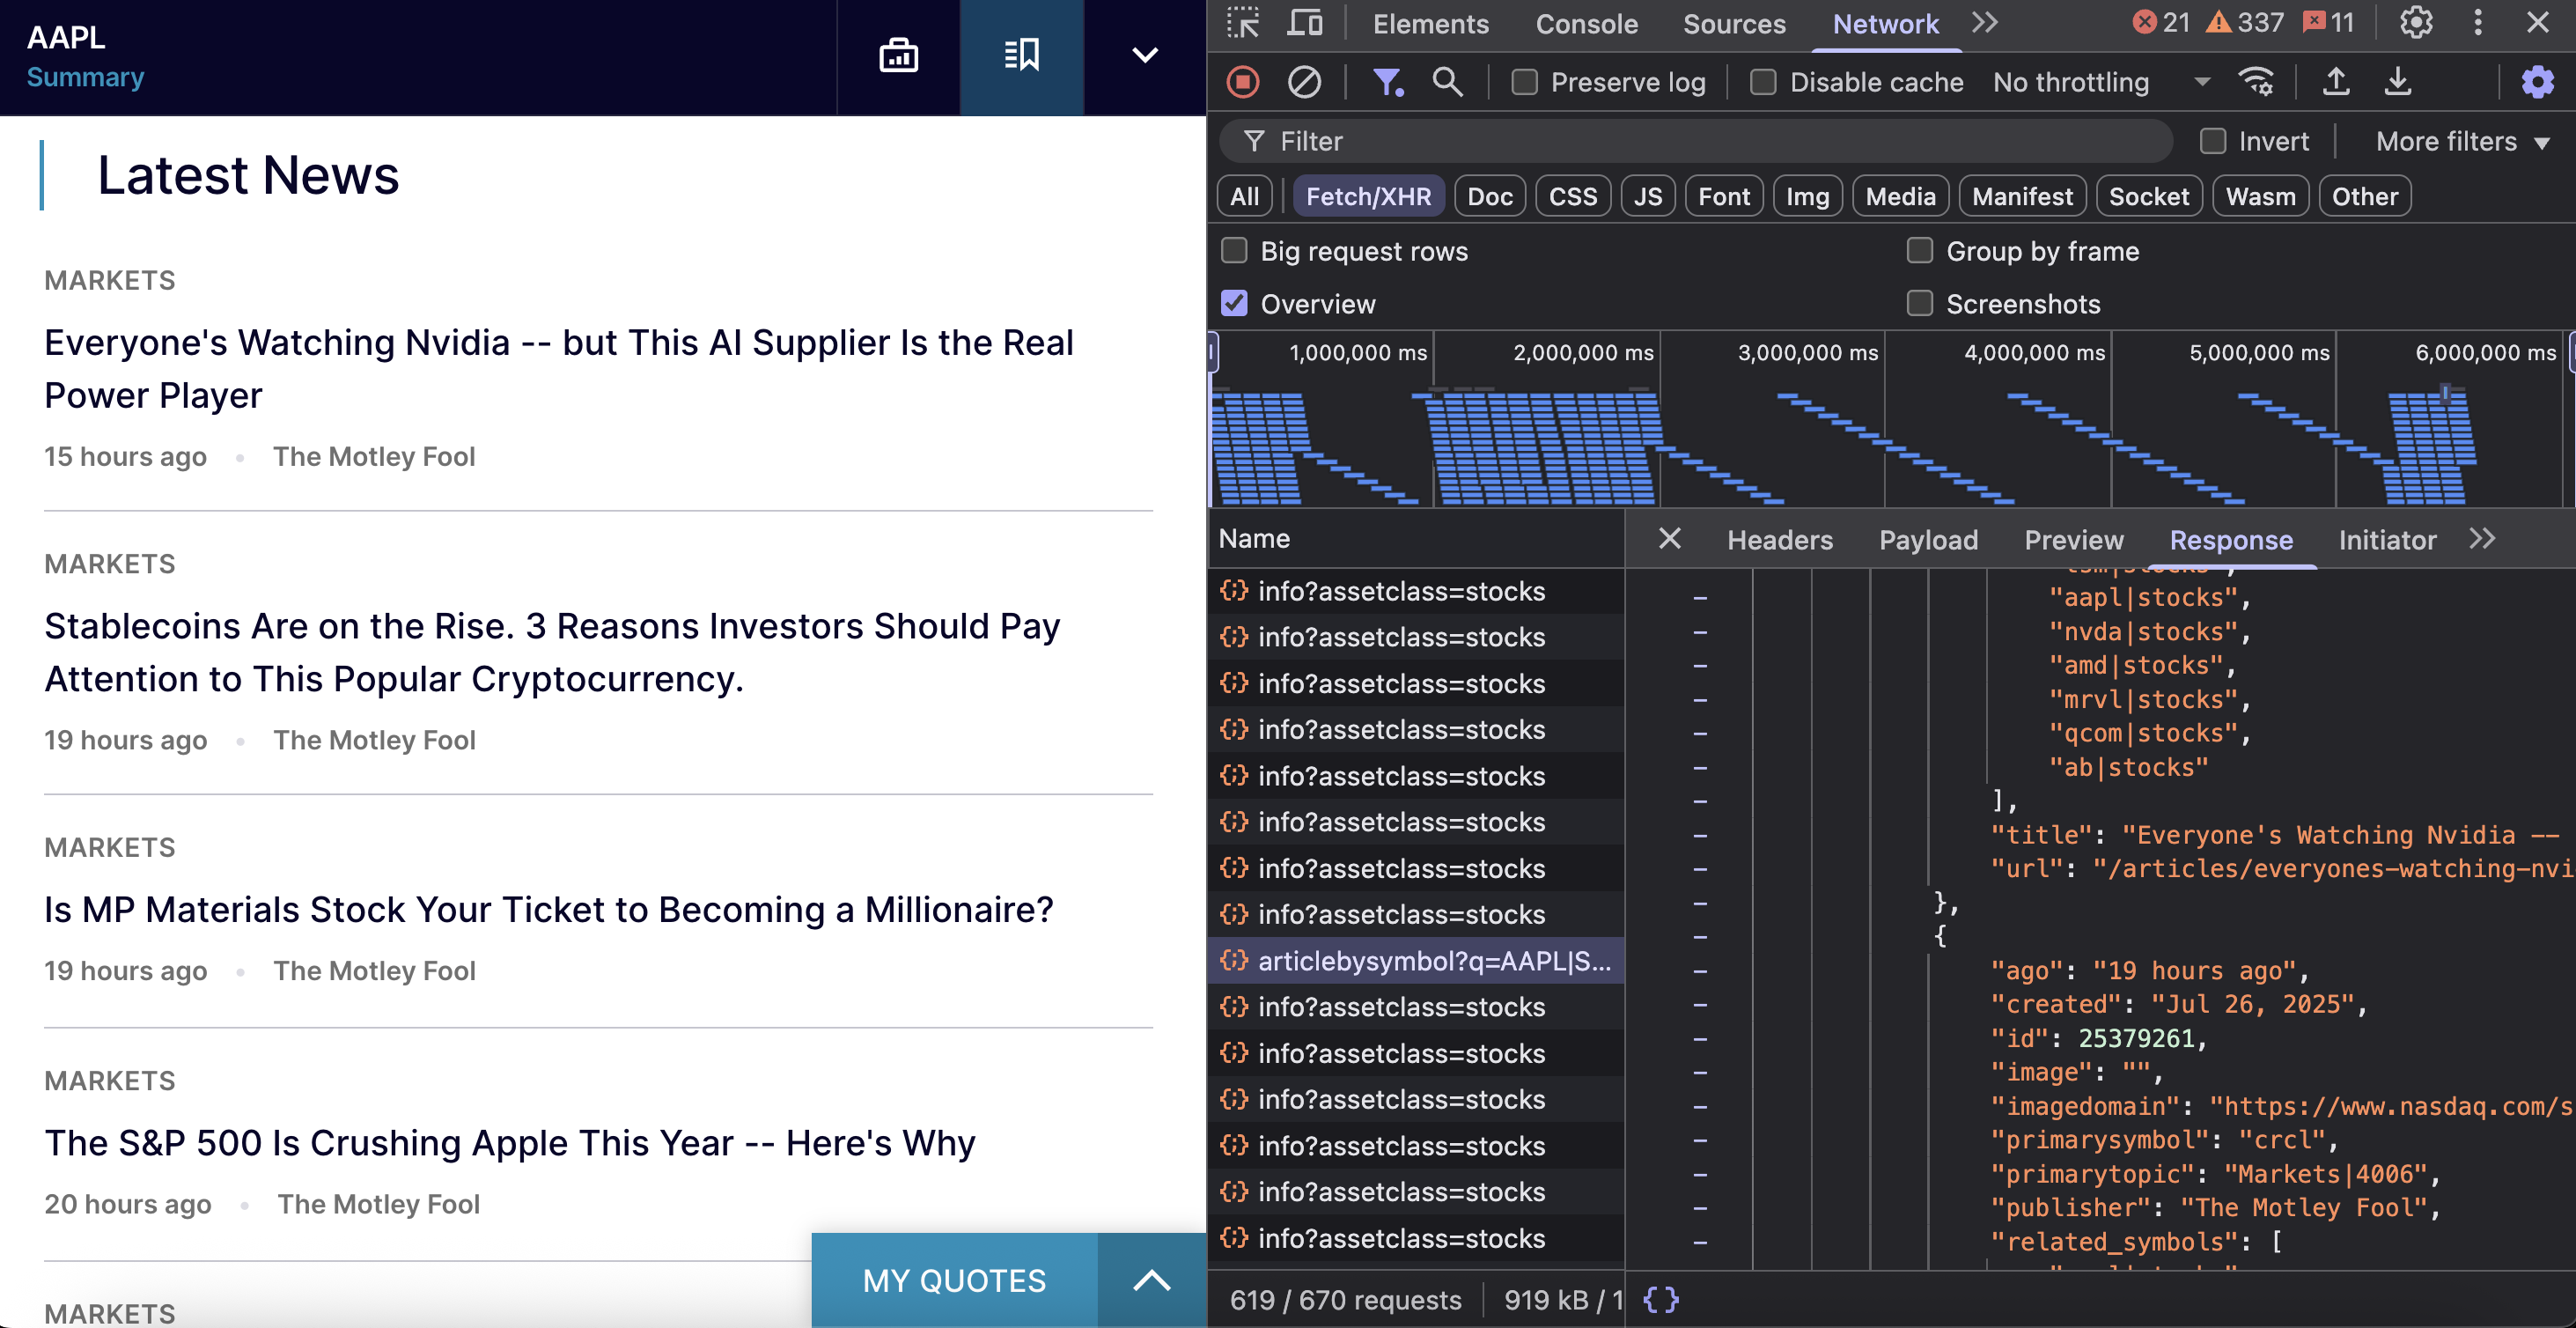
The endpoint is https://www.nasdaq.com/api/news/topic/articlebysymbol?q={symbol}|STOCKS&offset={offset}&limit={limit}&fallback=true.
What you need to pass:
- q – stock ticker symbol with |STOCKS suffix (like AAPL|STOCKS or MSFT|STOCKS)
- offset – number of records to skip for pagination (starts at 0)
- limit – maximum number of articles to return (default is 10)
- fallback – boolean flag for fallback behavior (recommended: true)
Here’s a quick implementation:
import requests

def get_news_data(symbol, headers):
    url = f'https://www.nasdaq.com/api/news/topic/articlebysymbol?q={symbol}|STOCKS&offset=0&limit=10&fallback=true'
    response = requests.get(url, headers=headers)
    return response.json()

headers = {
    'accept': 'application/json',
    'user-agent': 'Mozilla/5.0 (Macintosh; Intel Mac OS X 10_15_7) AppleWebKit/537.36 (KHTML, like Gecko) Chrome/138.0.0.0 Safari/537.36',
}
news_data = get_news_data('AAPL', headers)

print(news_data)
The API returns a structured JSON response that looks like this:
{
    "data": {
        "message": null,
        "rows": [...],           // Array of news articles
        "totalrecords": 8905     // Total number of available articles
    }
}
Each news article contains detailed information:
{
    "ago": "15 hours ago",
    "created": "Jul 26, 2026",
    "id": 25379586,
    "image": "",
    "imagedomain": "https://www.nasdaq.com/sites/acquia.prod/files",
    "primarysymbol": "tsm",
    "primarytopic": "Markets|4006",
    "publisher": "The Motley Fool",
    "related_symbols": [
        "tsm|stocks",
        "aapl|stocks",
        "nvda|stocks"
    ],
    "title": "Everyone's Watching Nvidia -- but This AI Supplier Is the Real Power Player",
    "url": "/articles/everyones-watching-nvidia-ai-supplier-real-power-player"
}
The API uses simple offset-based pagination to help you navigate through thousands of articles efficiently. Here’s how pagination works:
- First batch –
offset=0&limit=10retrieves articles 1-10 - Second batch –
offset=10&limit=10retrieves articles 11-20 - Third batch –
offset=20&limit=10retrieves articles 21-30
To get the next set of articles, increment the offset by your limit value.
Method 2 – scaling NASDAQ data scraping with residential proxies
While direct API access works well for most use cases, scaling to enterprise-level data collection introduces significant web scraping challenges. High-volume operations face rate limits, bot detection systems, and IP blocks that can halt data collection entirely.
The primary bottleneck in large-scale scraping is IP reputation management. Financial sites like NASDAQ deploy advanced anti-bot systems that actively monitor request patterns and frequency from individual IP addresses. When these systems detect automated traffic patterns from a single IP source, they implement blocks ranging from rate limiting to complete IP bans.
Residential proxies solve these issues by routing requests through real home internet connections. This makes your requests appear like legitimate user traffic distributed across different geographic locations, significantly reducing the likelihood of triggering anti-bot systems.
Our residential proxy infrastructure provides 400M+ residential IPs across 195+ locations, specifically designed for enterprise-scale data collection. New users can begin with our quickstart guide for basic implementation, while enterprise customers requiring advanced configurations can reference our detailed setup documentation.
Setting up residential proxies with Python requests requires minimal configuration. Configure your proxy credentials as follows:
proxies = {
    'http': 'http://brd-customer-{CUSTOMER_ID}-zone-{ZONE_NAME}:{PASSWORD}@brd.superproxy.io:{PORT}',
    'https': 'http://brd-customer-{CUSTOMER_ID}-zone-{ZONE_NAME}:{PASSWORD}@brd.superproxy.io:{PORT}'
}
Here’s the full implementation:
import requests
import urllib3

# Disable SSL warnings
urllib3.disable_warnings(urllib3.exceptions.InsecureRequestWarning)

proxies = {
    "http": "http://brd-customer-{CUSTOMER_ID}-zone-{ZONE_NAME}:{PASSWORD}@brd.superproxy.io:{PORT}",
    "https": "http://brd-customer-{CUSTOMER_ID}-zone-{ZONE_NAME}:{PASSWORD}@brd.superproxy.io:{PORT}",
}

headers = {
    "accept": "application/json, text/plain, */*",
    "user-agent": "Mozilla/5.0 (Macintosh; Intel Mac OS X 10_15_7) AppleWebKit/537.36 (KHTML, like Gecko) Chrome/138.0.0.0 Safari/537.36",
}

response = requests.get(
    "https://www.nasdaq.com/api/news/topic/articlebysymbol?q=AAPL|STOCKS&offset=0&limit=10&fallback=true",
    headers=headers,
    proxies=proxies,
    verify=False,
    timeout=30,
)

print(f"Status Code: {response.status_code}")
print(response.json())
With this residential proxy setup, you can run hundreds or thousands of concurrent requests across different IP addresses without triggering rate limits.
We also offer a free, open‑source proxy manager tool that provides advanced control over your proxy operations, such as centralized proxy management, real‑time request monitoring, advanced rotation settings and more. Our setup guide walks you through the configuration process.
Method 3 – AI-powered NASDAQ data scraping with MCP
The Model Context Protocol standardizes AI-to-data integration, enabling natural language interactions with web scraping infrastructure. The Bright Data MCP implementation combines data collection solutions with AI-powered extraction, streamlining scraping operations through conversational interfaces.
This MCP server for financial data extraction simplifies the complexity of endpoint discovery, header management, and anti-bot protection by leveraging web data infrastructure. The system intelligently navigates and extracts data from modern websites like NASDAQ, handling JavaScript rendering, dynamic content, and security systems while delivering structured data outputs.
Now, let’s see it in action by integrating Bright Data MCP with the Claude desktop. Navigate to the Claude desktop application, then go to Settings > Developer > Edit Config. You’ll see the claude_desktop_config.json file, where you need to add the following configuration:
{
  "mcpServers": {
    "Bright Data": {
      "command": "npx",
      "args": ["@brightdata/mcp"],
      "env": {
        "API_TOKEN": "<your-brightdata-api-token>",
        "WEB_UNLOCKER_ZONE": "<optional – override default zone name 'mcp_unlocker'>",
        "BROWSER_AUTH": "<optional – enable full browser control via Scraping Browser>"
      }
    }
  }
}
Configuration requirements:
- API token – set up your Bright Data account and generate an API token from your dashboard.
- Web Unlocker zone – specify your Web Unlocker zone name or use the default
mcp_unlocker. - Scraping Browser (Browser API) configuration – For dynamic content scenarios, configure the Browser API for JavaScript-rendered pages. Use the
Username:Passwordcredentials from the Overview tab of your Browser API zone.
Once the configuration is complete, quit the Claude desktop application and reopen it. You’ll see the Bright Data option available, indicating that the MCP tools are now integrated into your Claude environment.

With Claude and Bright Data MCP integration, you can extract data through conversational prompts without writing code.
Example prompt: “Extract key data from NASDAQ URL in JSON format: https://www.nasdaq.com/market-activity/stocks/aapl. Handle dynamic loading since NASDAQ uses JavaScript rendering.”
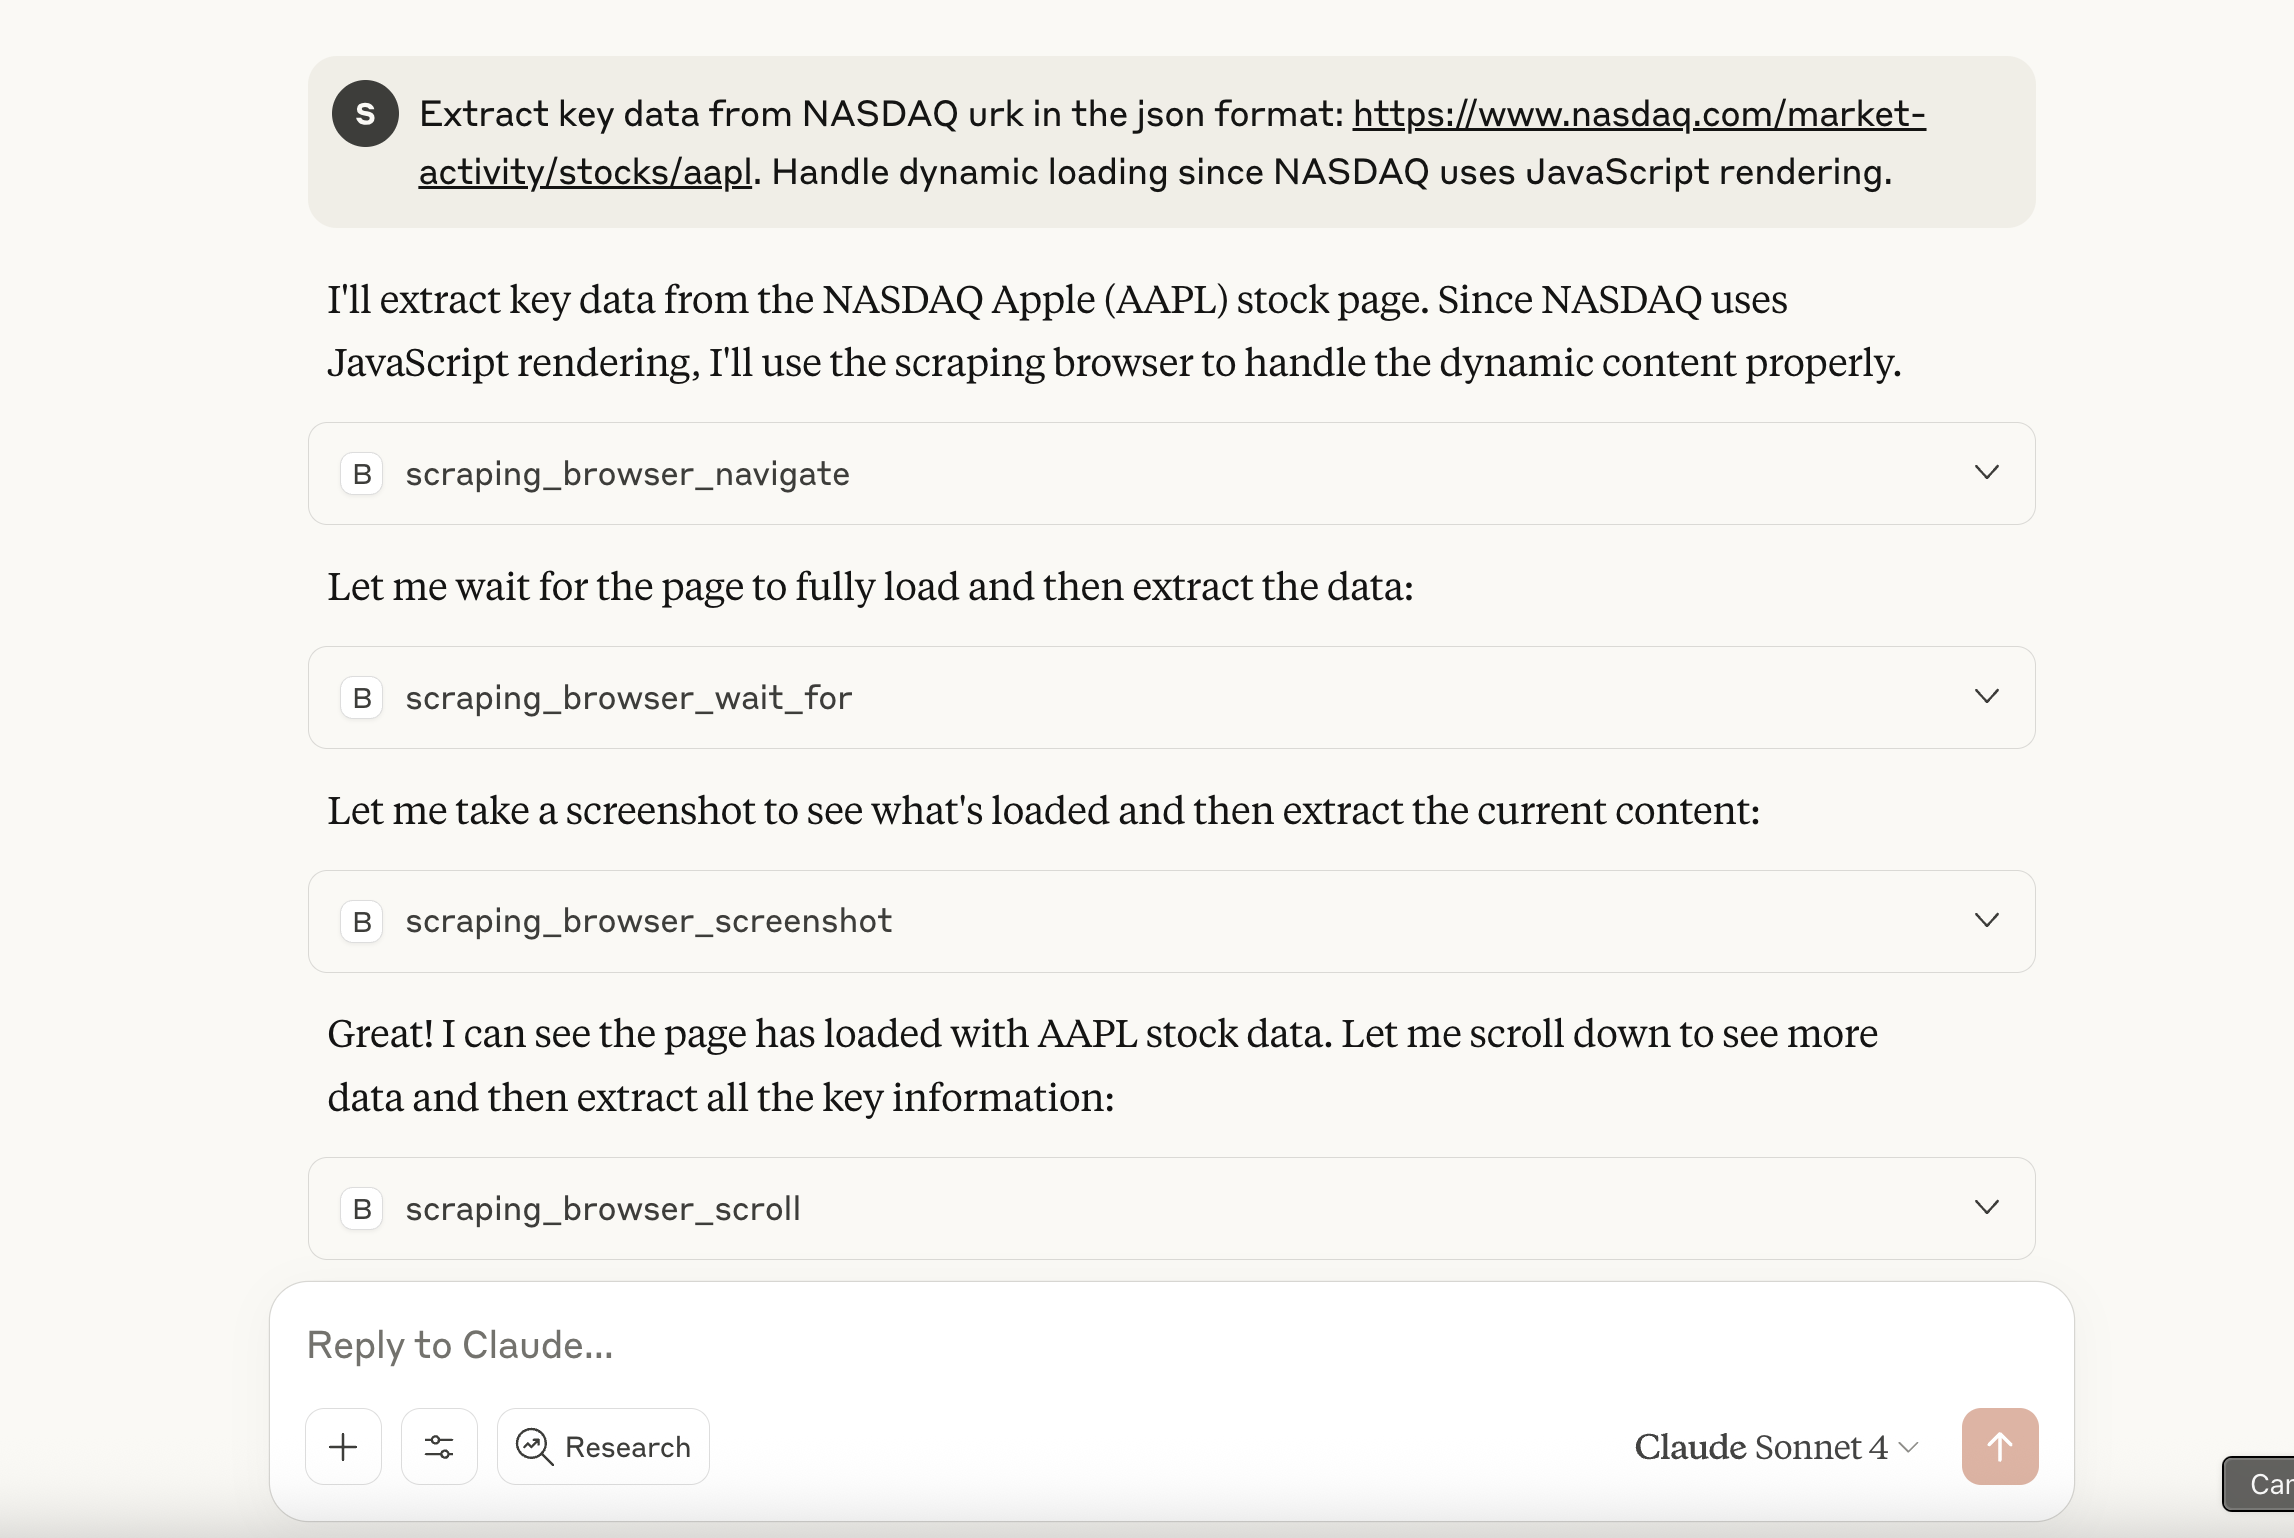
Allow tool permissions when prompted. The system automatically calls Bright Data MCP tools, using the Browser API to handle JavaScript rendering and bypass anti-bot protections. It then returns structured JSON data with comprehensive stock information.
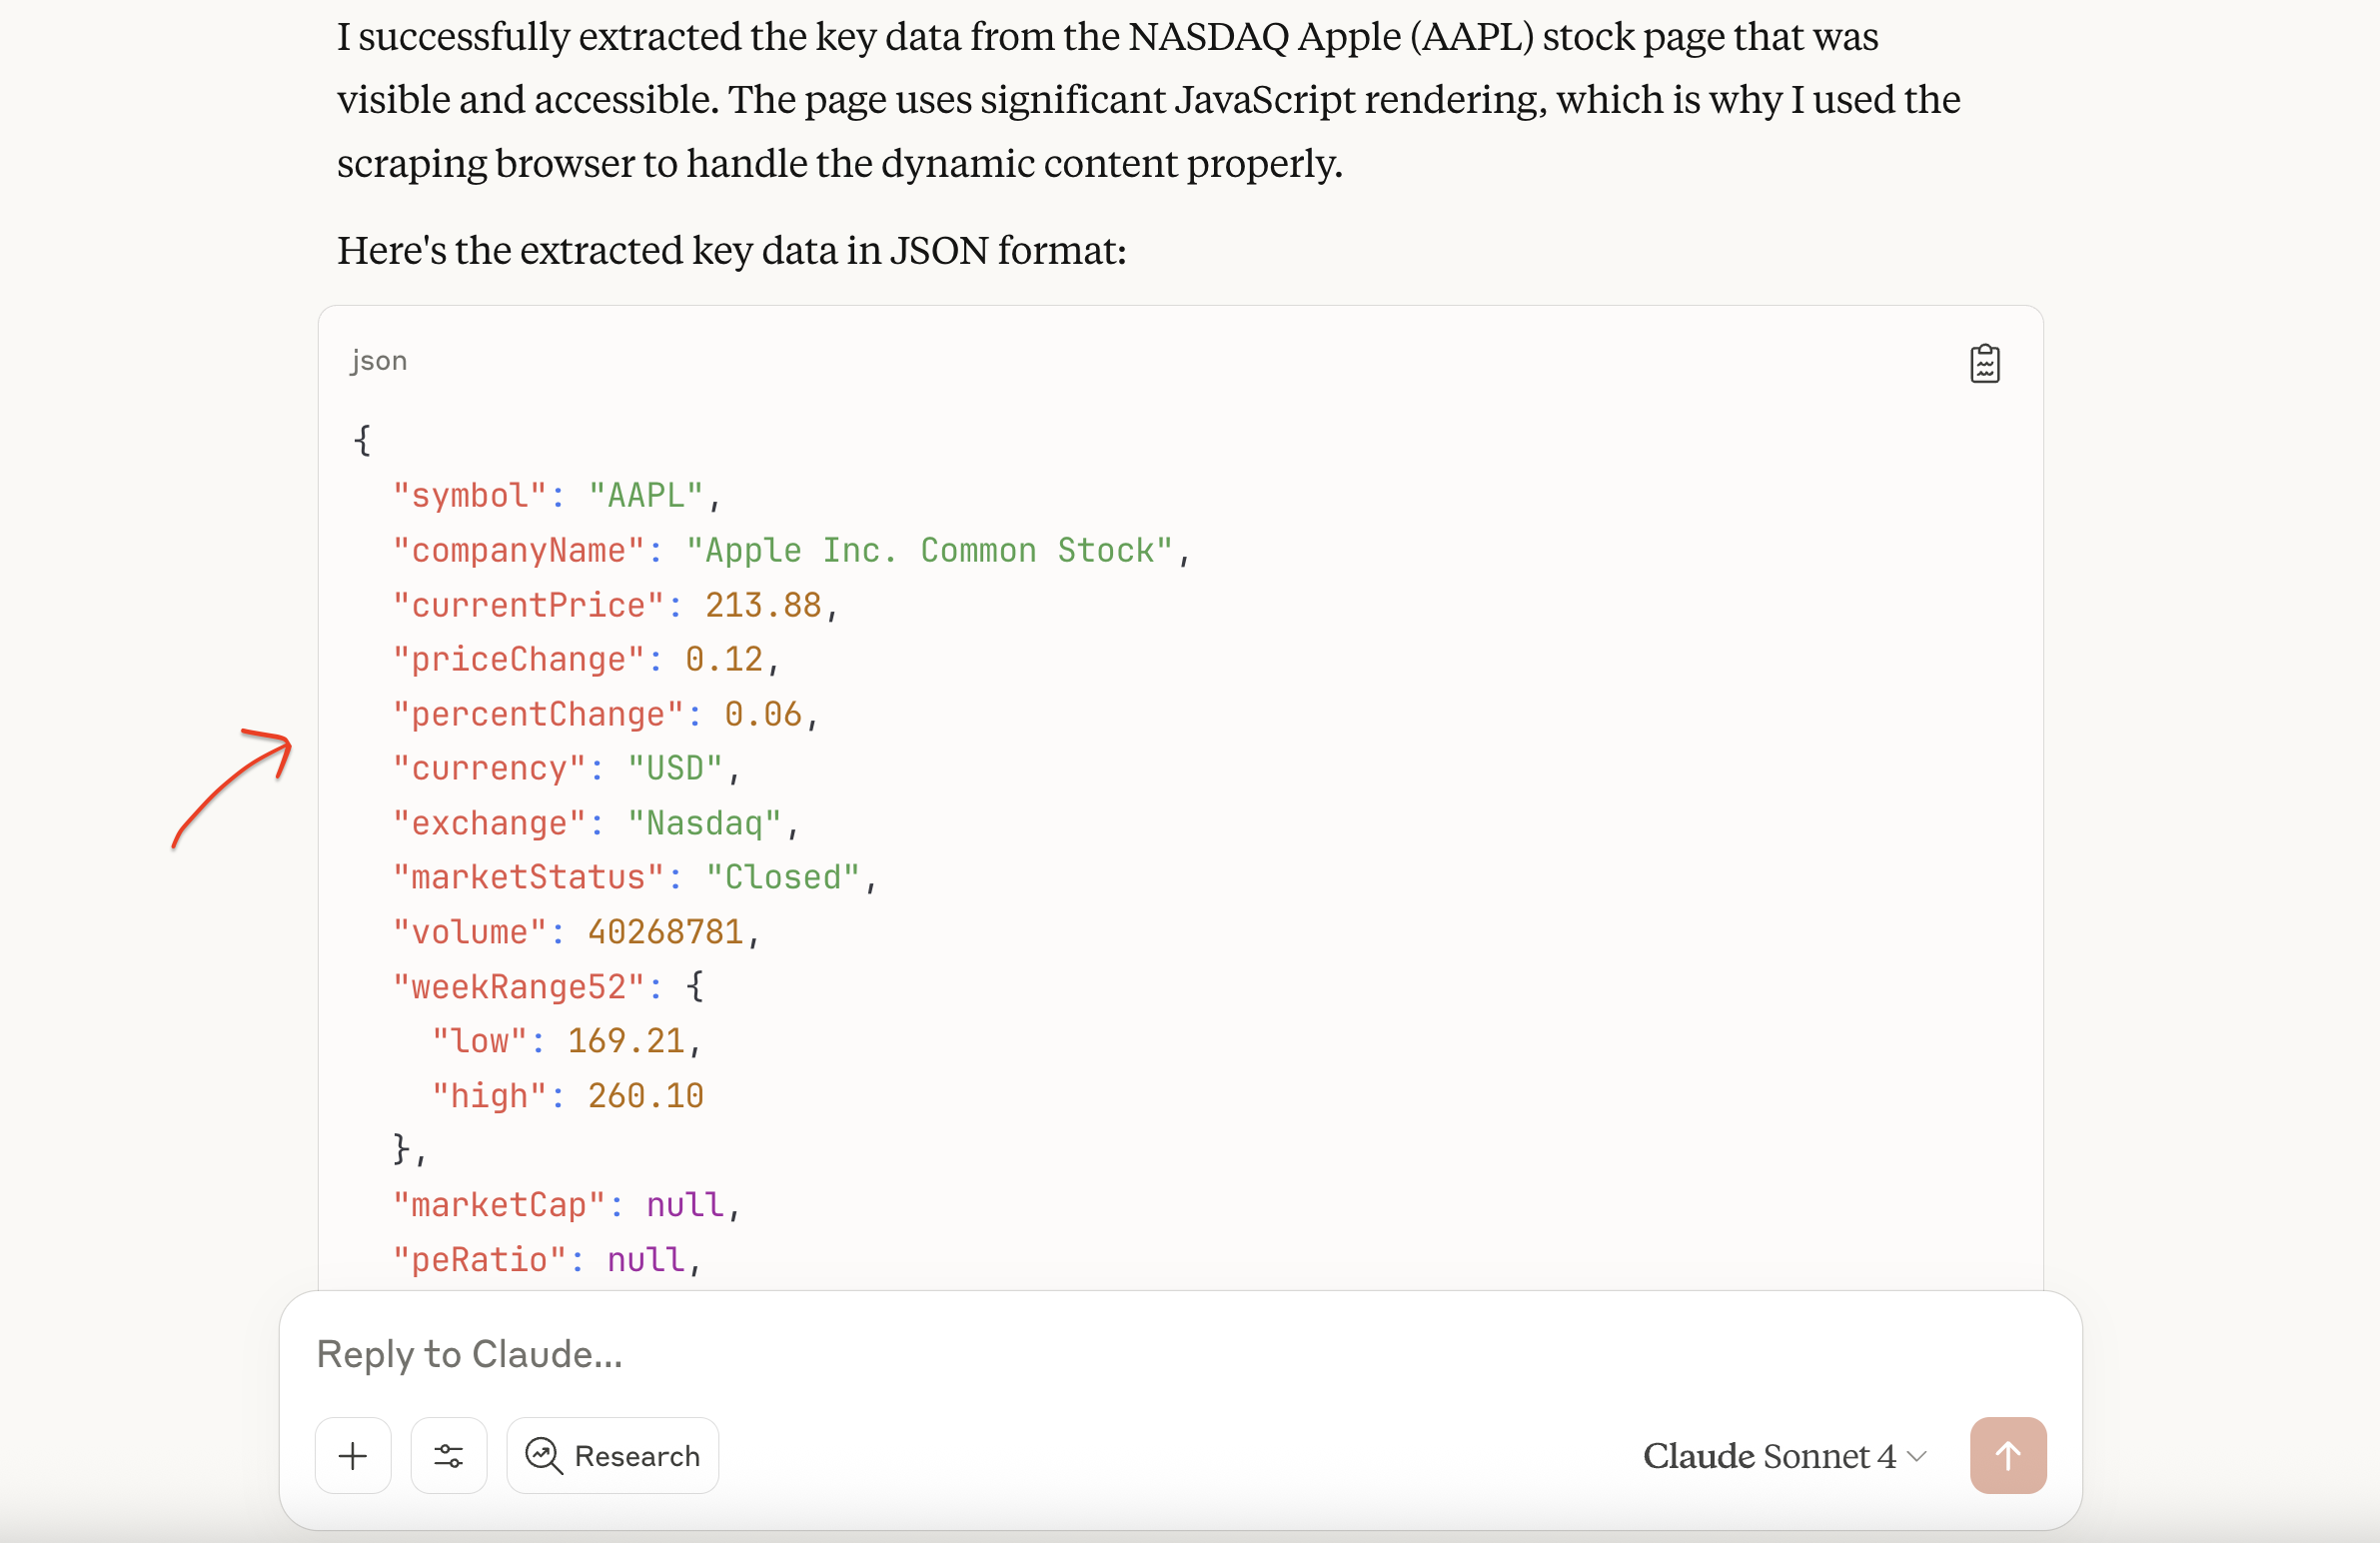
This shows one application of MCP for financial data extraction. The protocol’s versatility extends well beyond financial scraping, as teams building AI workflows regularly combine multiple MCP servers for different capabilities.
Our overview of leading MCP servers compares and highlights each provider’s unique capabilities, covering everything from web data extraction and browser automation to code integration and database management.
Conclusion
Scraping NASDAQ data effectively requires choosing the right approach for your specific needs. While basic scraping works for low-volume data extraction, production applications benefit significantly from robust proxy infrastructure and enterprise solutions.
For organizations requiring enterprise-level financial data solutions, it’s worth evaluating different options. Our analysis of leading financial data providers can help you decide between building custom scrapers and purchasing datasets from specialized vendors.
Beyond financial datasets, Bright Data’s extensive marketplace also offers business datasets, social media datasets, real estate datasets, ecommerce datasets, and many more.
With so many dataset options and collection approaches available, talk to one of our data experts to discover which of Bright Data’s products and services best suit your specific requirements.

Technical Writer
Satyam Tripathi helps SaaS and data startups turn complex tech into actionable content, boosting developer adoption and user understanding.