
In this blog post, you will learn:
- Why TensorFlow is an ideal tool for data analysis through machine learning.
- Which solutions you should rely on to gather high-quality data that provides valuable insights for your business.
- How to utilize TensorFlow to perform sentiment analysis on Amazon product reviews retrieved via Bright Data.
Let’s dive in!
Why Analyze Data via TensorFlow Using Machine Learning
Data is valuable because of the insights it helps you gain. This is especially true for businesses, which harness data to make decisions, adjust strategies, and optimize results. Common goals include improving customer satisfaction and optimizing the overall performance of marketing strategies.
When it comes to data analysis, TensorFlow is one of the most popular open-source libraries. It powers machine learning and artificial intelligence systems, supporting a wide range of tasks.
In particular, in this article, we will utilize TensorFlow to perform sentiment analysis on product reviews. At the same time, the same technology can be applied to many other use cases, such as customer feedback analysis, recommendation systems, predictive modeling, and others.
How to Retrieve Data from Your Business
No matter how advanced your machine learning or artificial intelligence pipeline is, all data analysts know that “more data beats better algorithms.” Simply put, the key to gaining meaningful insights is the quality and quantity of the data.
But how do you get a lot of good data? Data sourcing can be challenging, and it is important to rely on trusted data providers, such as Bright Data.
Bright Data equips you with a wide range of data solutions, including:
- Web Scraper API: Programmatic access to structured web data from dozens of popular domains, retrieved via web scraping.
- Dataset Marketplace: Fresh, ready-to-use datasets with billions of entries from 100+ websites.
- Managed Data Acquisition Services: Fully managed, enterprise-grade data collection services, allowing you to get data and insights without the hassle of development or maintenance.
These products cater to researchers, SMBs (small and medium-sized businesses), and enterprises. In detail, they enable the collection of public web data to power machine learning workflows, AI training, agent development, and a long list of other scenarios.
How to Perform Sentiment Analysis on Amazon Product Reviews Retrieved via Bright Data
In this step-by-step section, you will use TensorFlow to build a real-world data analysis workflow. We will cover the practical use case of performing sentiment analysis on product reviews.
Assume you are an enterprise selling multiple products on Amazon. To improve customer satisfaction, you need a process that periodically monitors the reviews left by users for each product and performs sentiment analysis to understand what is working well and what needs improvement.
In this example, we will focus on the following Amazon product:
Note: You can extend this workflow to multiple Amazon products, as the Bright Data Amazon Reviews Scraper supports scraping reviews from multiple products with unlimited scalability.
This is a great example, as it has a large number of reviews that are reasonably distributed across all 5 stars: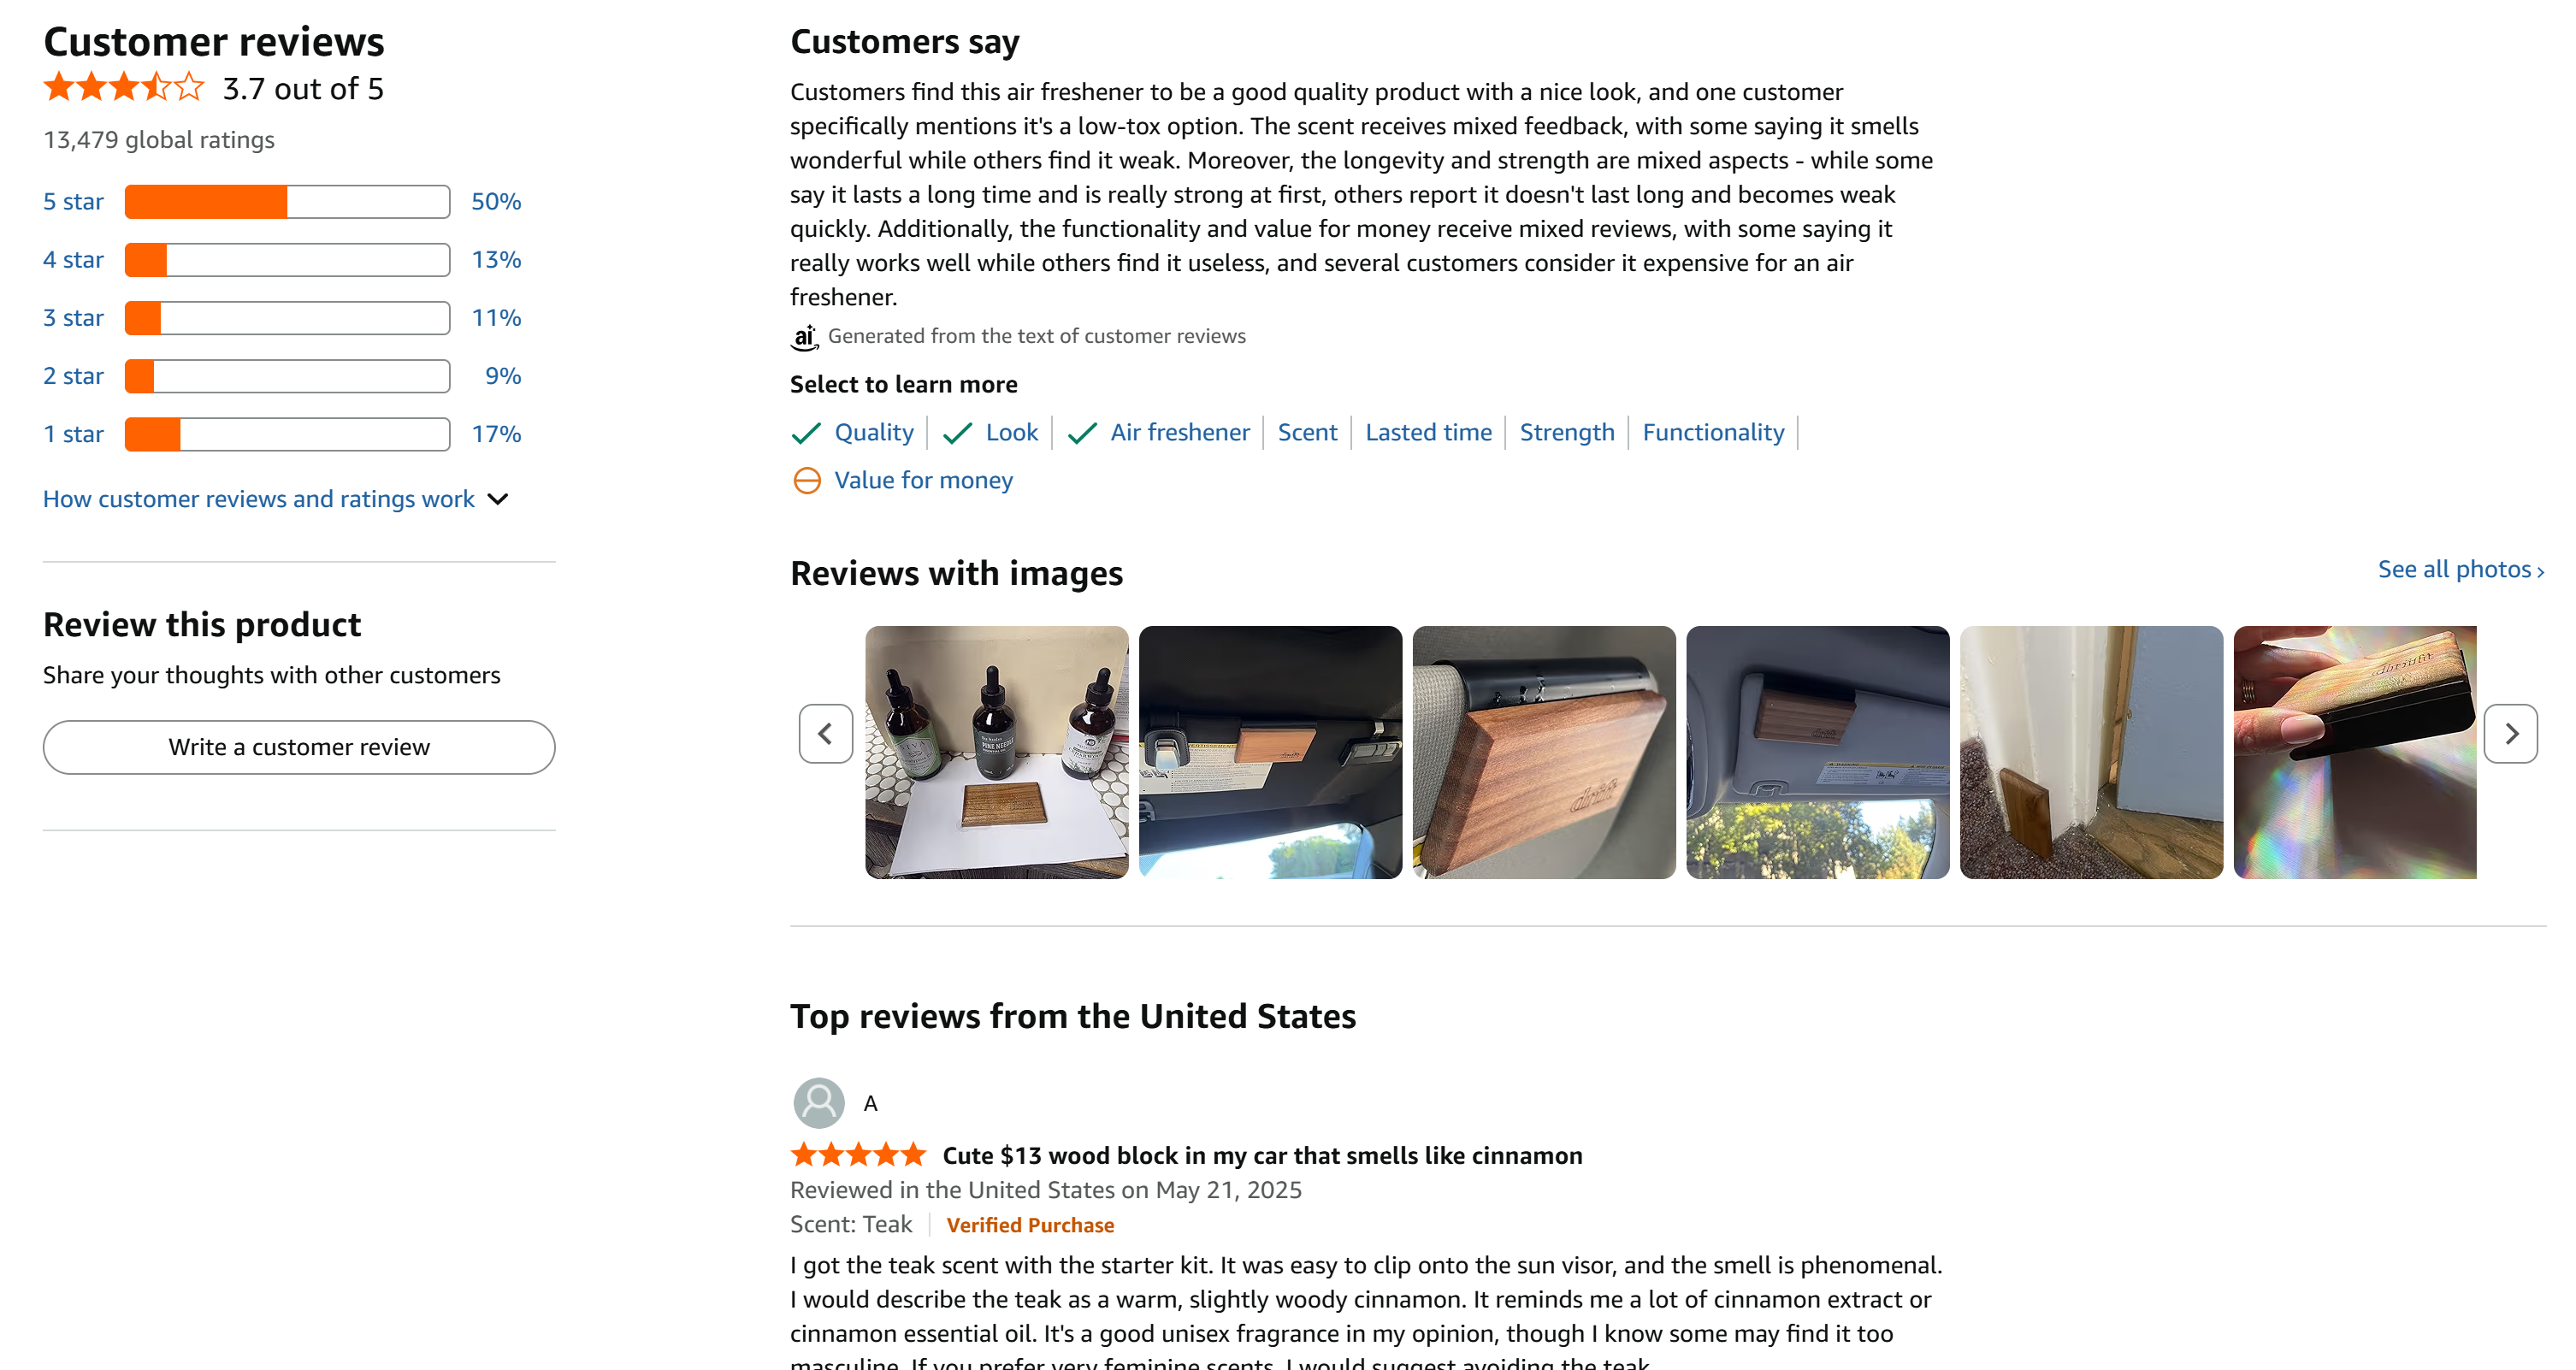
Follow the instructions below to build an enterprise-ready sentiment analysis process. The reviews for the product will be retrieved via Bright Data and then analyzed using machine learning workflows in TensorFlow with Python.
Prerequisites
To follow along with this tutorial, make sure you have:
- Python 3.9+ installed locally.
- A Bright Data account with an API key in place.
Do not worry if you do not have a Bright Data account yet, as you will be guided through the setup process in the following steps.
Familiarity with the Universal Sentence Encoder model, how vector embeddings work, and how Keras Sequential models with dense neural network layers operate will be very useful for fully understanding the sentiment analysis TensorFlow logic.
Step #1: Set Up a JupyterLab Project
Since this TensorFlow machine learning process will also involve charts and data visualization, it makes sense to use JupyterLab as the development environment. Then, the code can be easily migrated to a production-ready ML pipeline.
First, start by creating a project folder. Navigate into it:
mkdir tensorflow-brightdata-product-review-analysis
cd tensorflow-brightdata-product-review-analysis
Next, initialize a virtual environment inside the folder:
python -m venv .venvTime to activate the virtual environment. On macOS/Linux, run:
source .venv/bin/activateOr, on Windows, execute:
.venvScriptsactivateIn the active environment, install JupyterLab via the jupyterlab package:
pip install jupyterlabProceed by launching JupyterLab with:
jupyter labYou will see the JupyterLab interface:
Define a new notebook by clicking the “Python 3 (ipykernel)” button under “Notebook” section: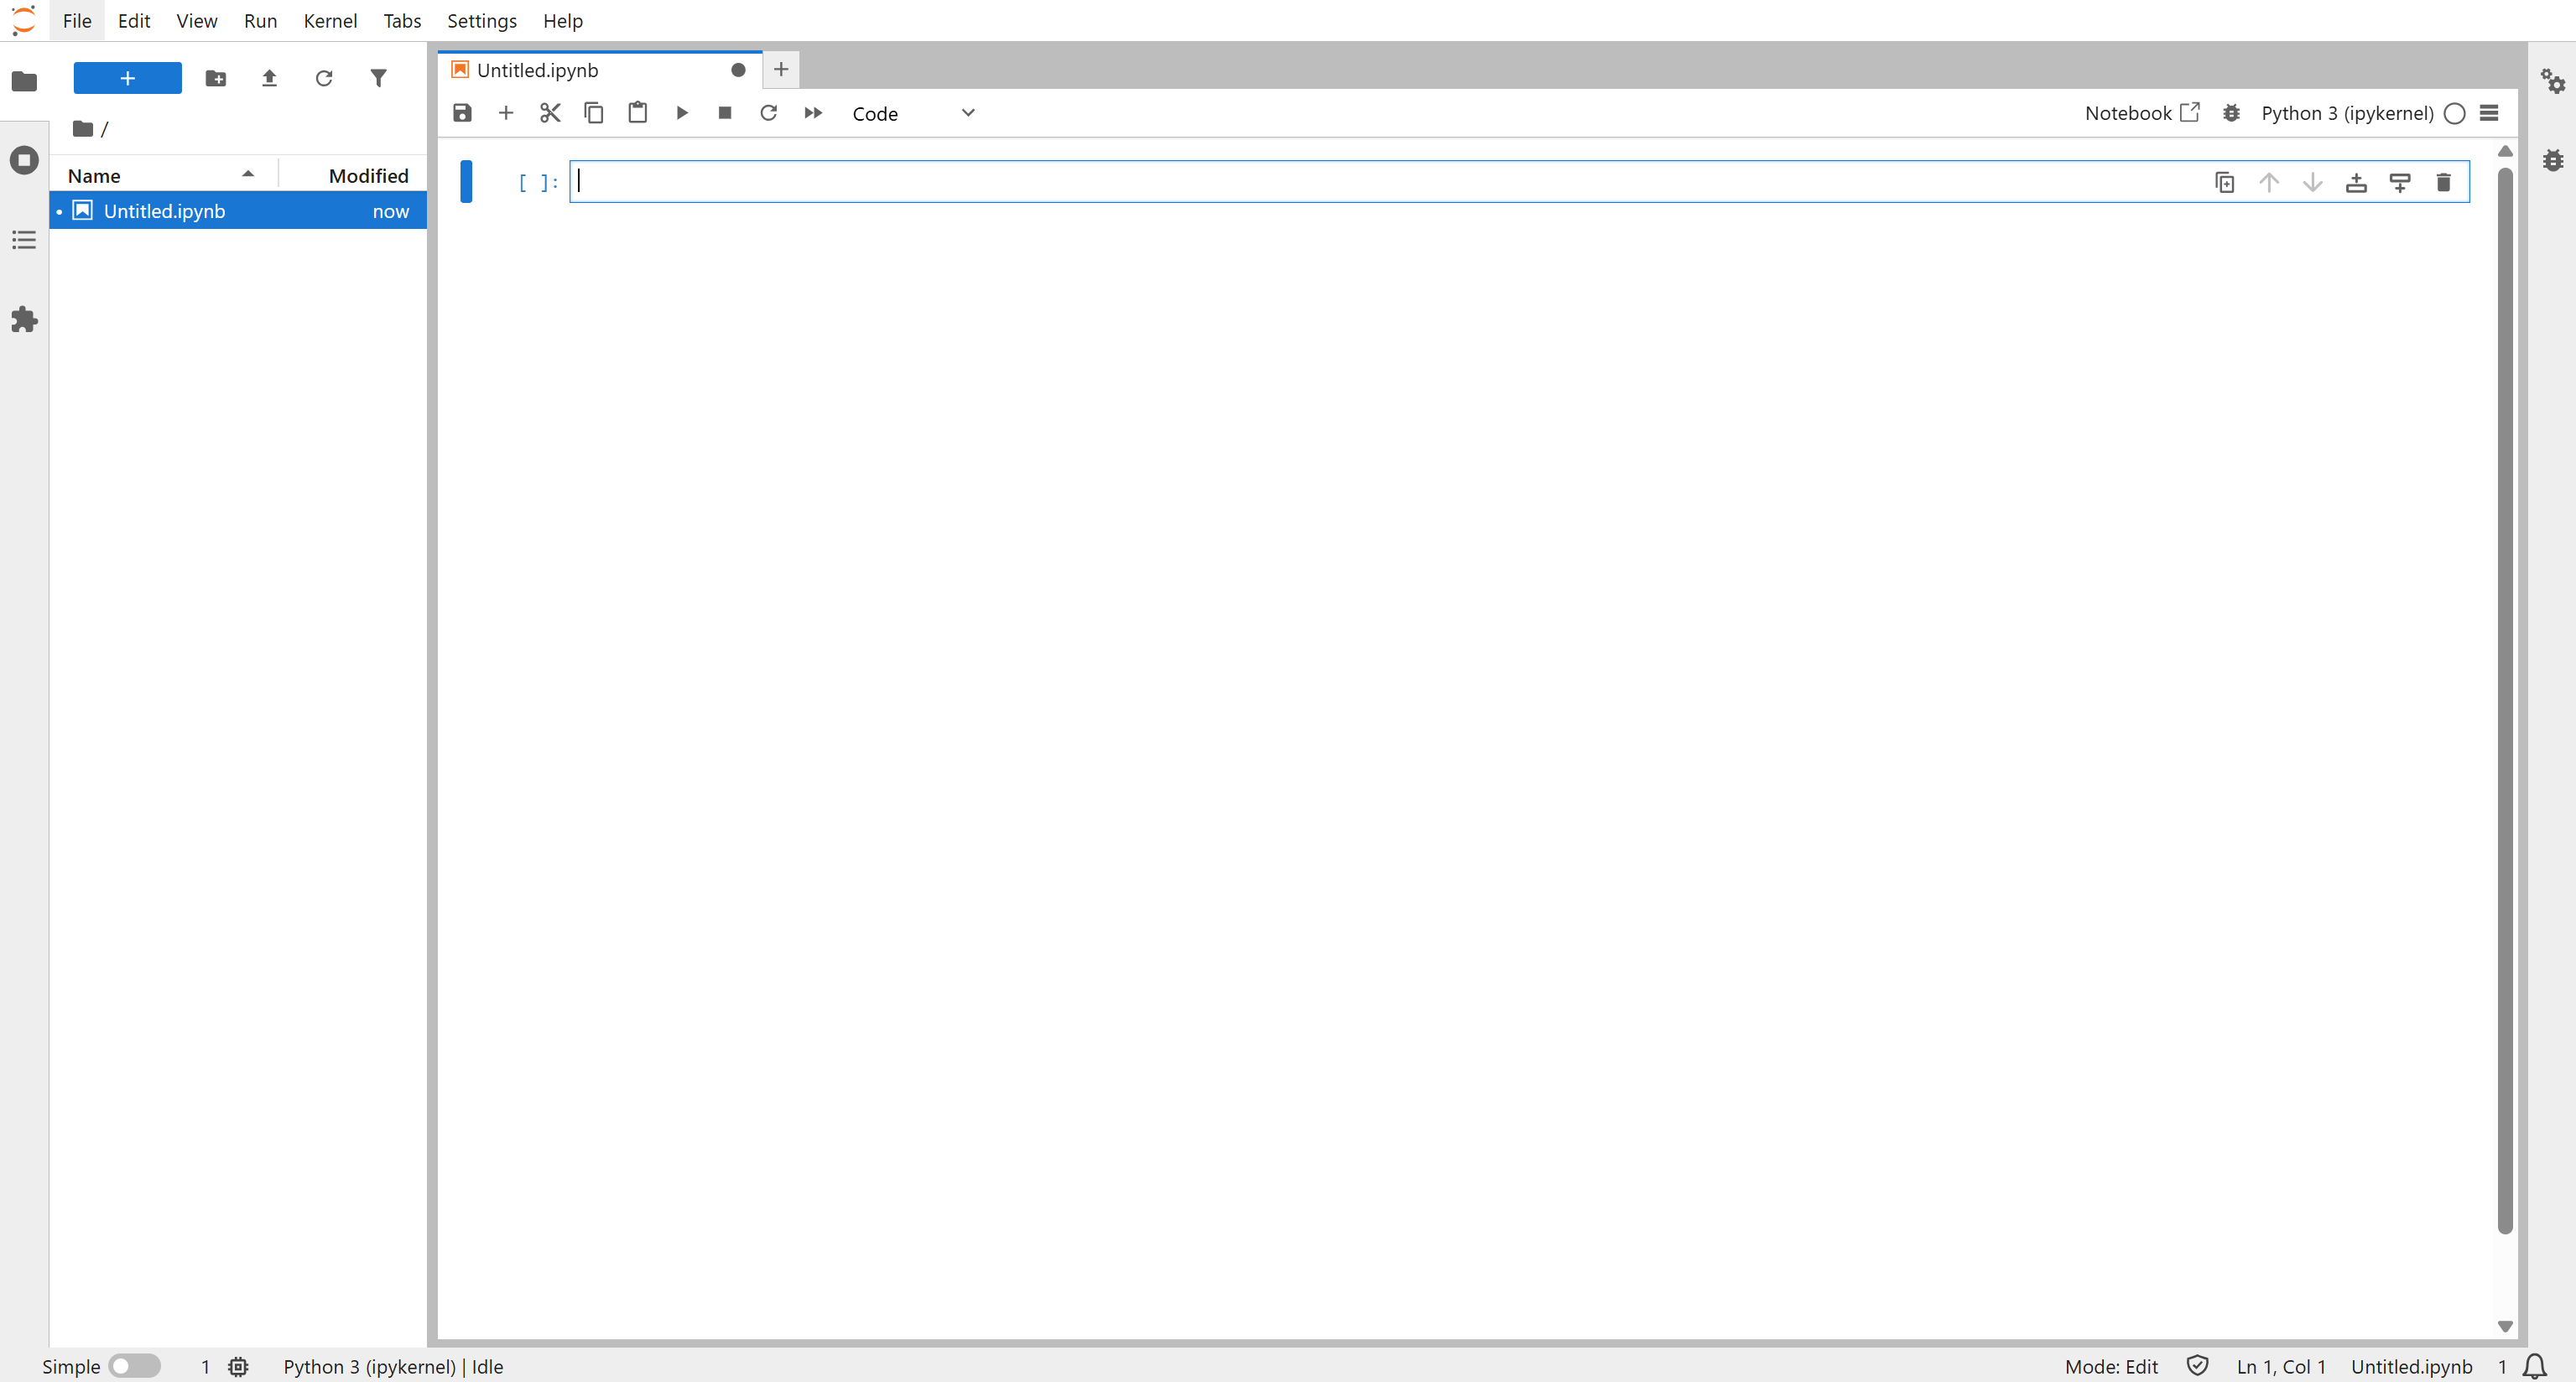
Give your notebook a name and save it.
Done! You now have a Python environment set up, ideal for developing machine learning data analysis workflows using TensorFlow.
Step #2: Install the Libraries
Add a code block and install the required libraries with:
!pip install tensorflow tensorflow-hub scikit-learn pandas numpy matplotlib requestsRun this block to install all the libraries needed for this implementation:
tensorflow: For building and training machine learning models.tensorflow-hub: To load pre-trained machine learning models.scikit-learn: For data preprocessing, train-test splitting, metrics, and class weighting.pandas: For handling tabular data and performing aggregations.numpy: For numerical computations and array handling.matplotlib: For plotting charts and visualizing results.requests: To perform HTTP requests and interact with the Bright Data Scraper API.
Next, add another code block to import and configure all required libraries:
import time
import requests
import pandas as pd
import numpy as np
import matplotlib.pyplot as plt
import tensorflow_hub as hub
from tensorflow import keras
from keras.layers import Input, Dense, Dropout
from keras.models import Sequential
from sklearn.model_selection import train_test_split
from sklearn.metrics import classification_report
from sklearn.utils.class_weight import compute_class_weight
from IPython.display import display, HTML

plt.rcParams["figure.figsize"] = (10, 5)
Amazing! With this, all your subsequent code blocks will be ready to power Bright Data retrieval and TensorFlow-based analysis workflows.
Step #3: Get Started with Bright Data Amazon Reviews Scraper
Before writing the code to retrieve Amazon reviews data, take some time to set up your Bright Data account and get familiar with the required data scraping solution.
In this tutorial, we will rely on the Bright Data Amazon Reviews API, which enables you to programmatically scrape fresh review data for a given product. This is ideal if you want to monitor reviews for your own products.
Alternatively, for more general scenarios, Bright Data also provides a ready-made “Amazon Reviews” dataset with over 28.6M reviews: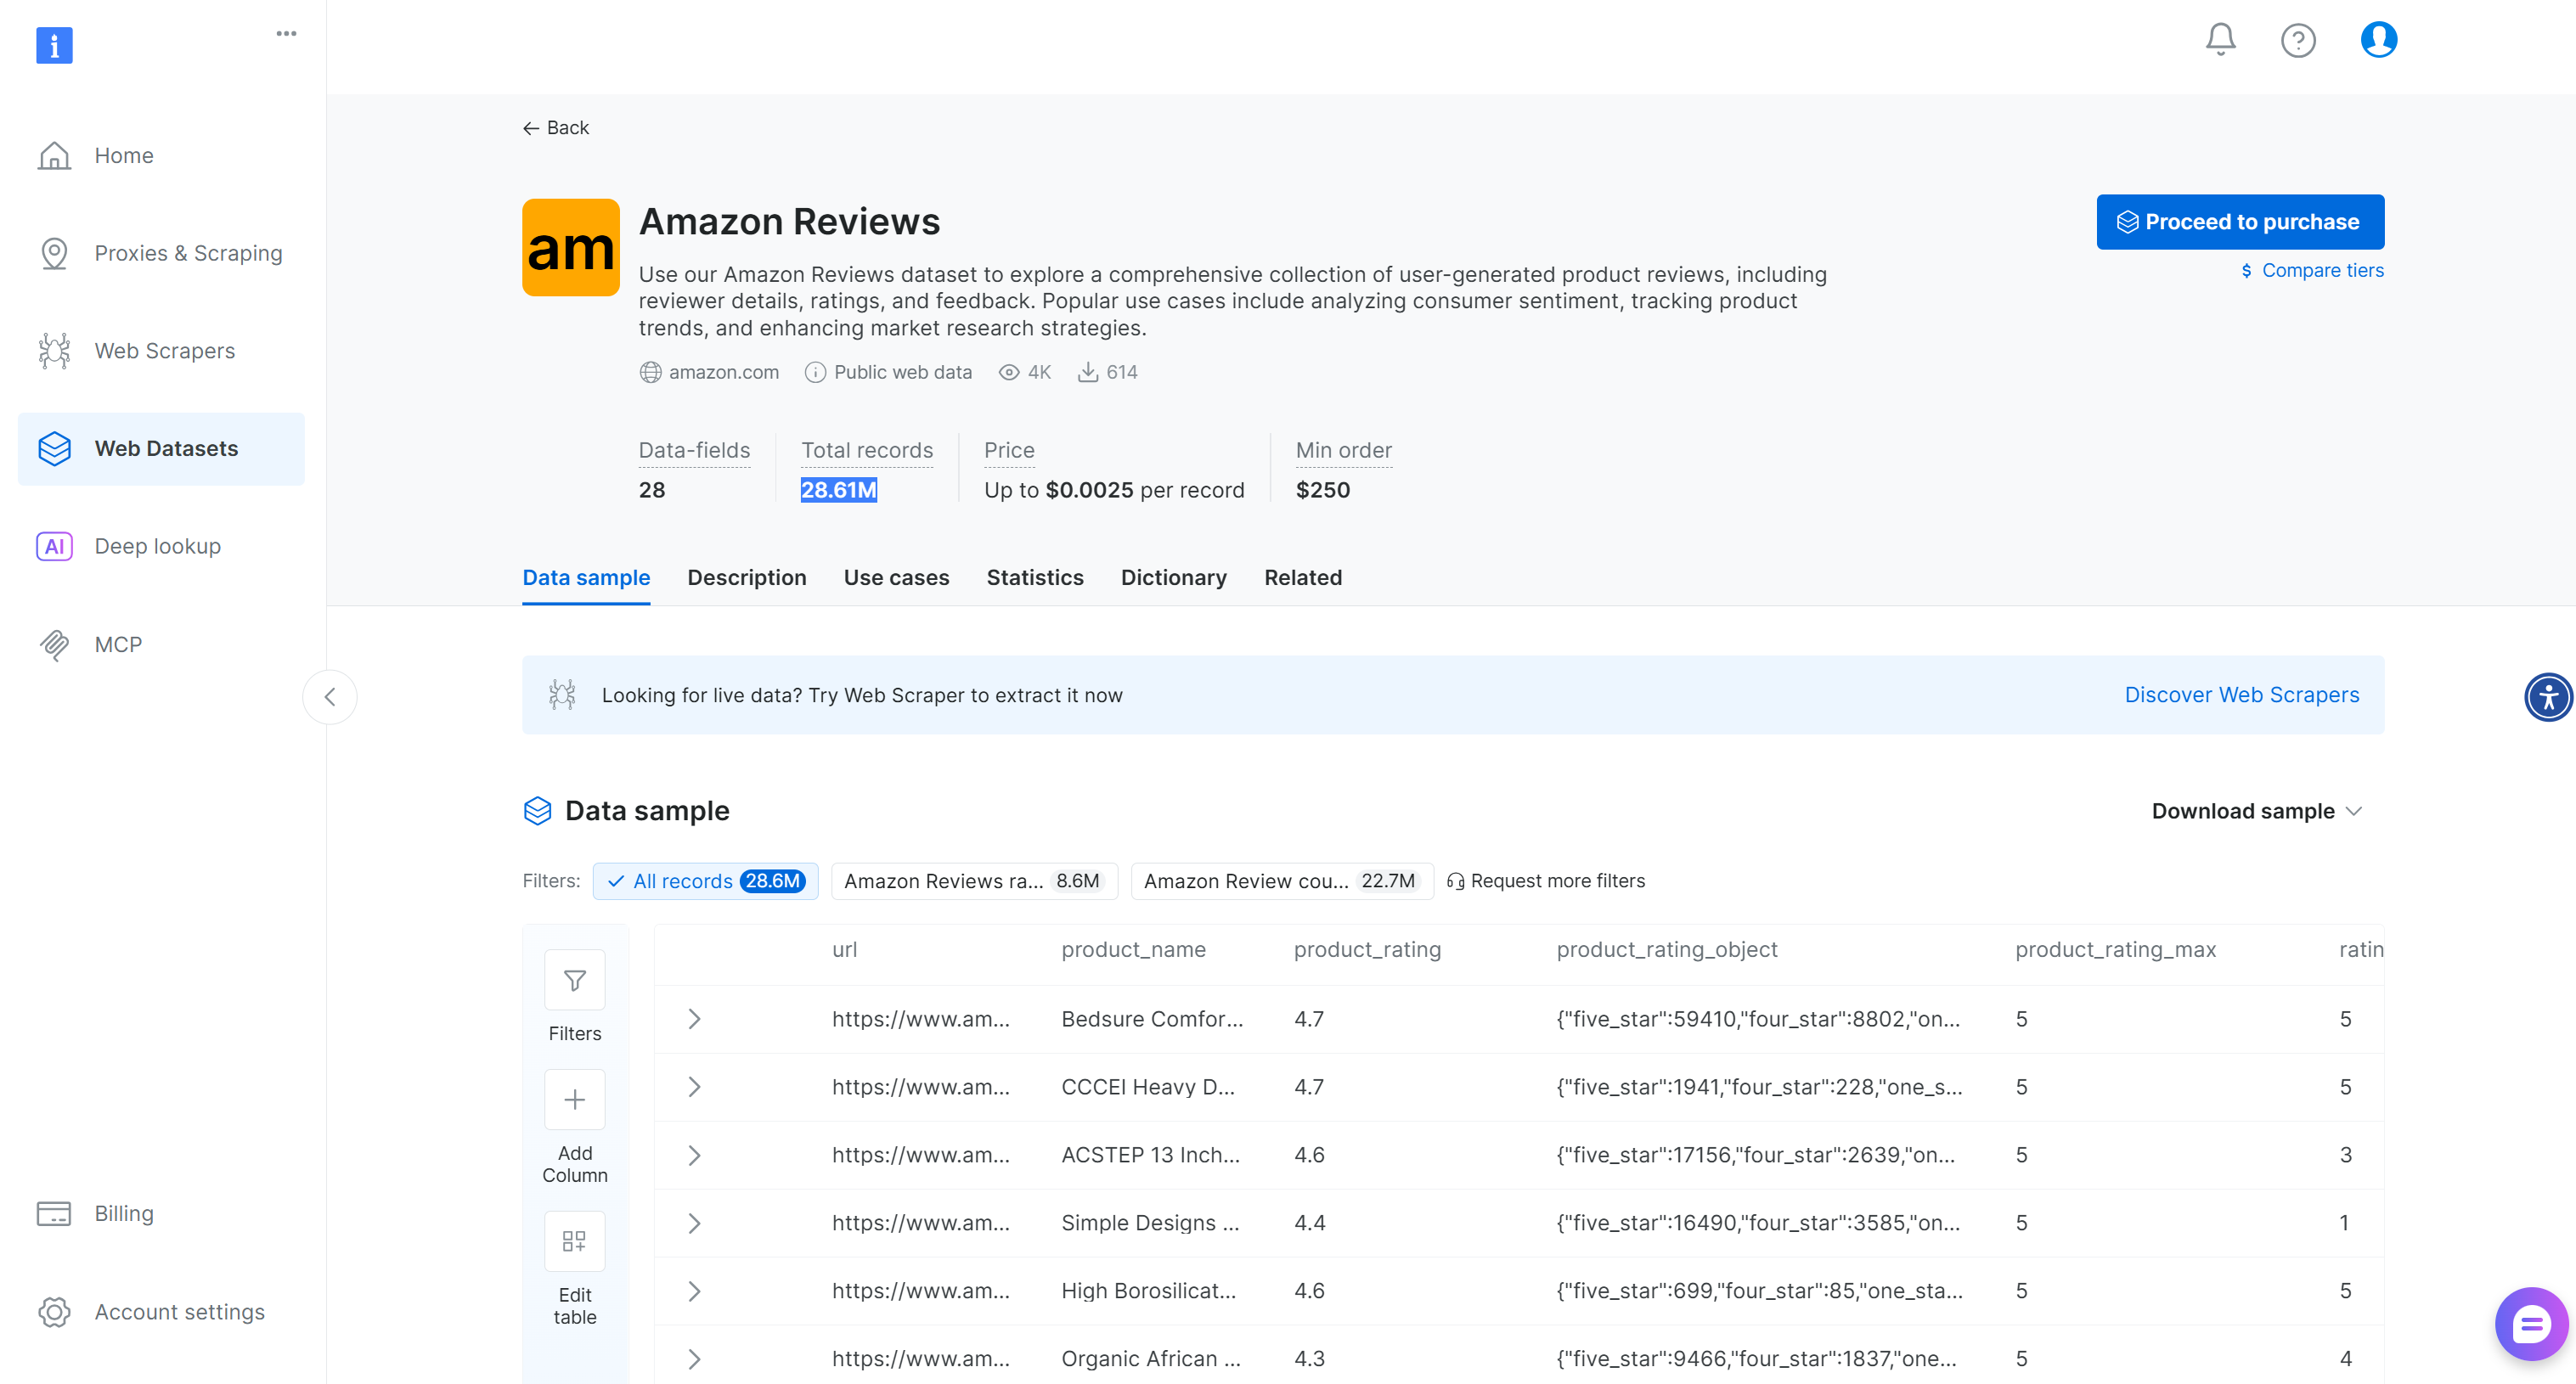
Now, if you do not have a Bright Data account yet, create one. Otherwise, log in and navigate to your account’s “Web Scrapers Library” page: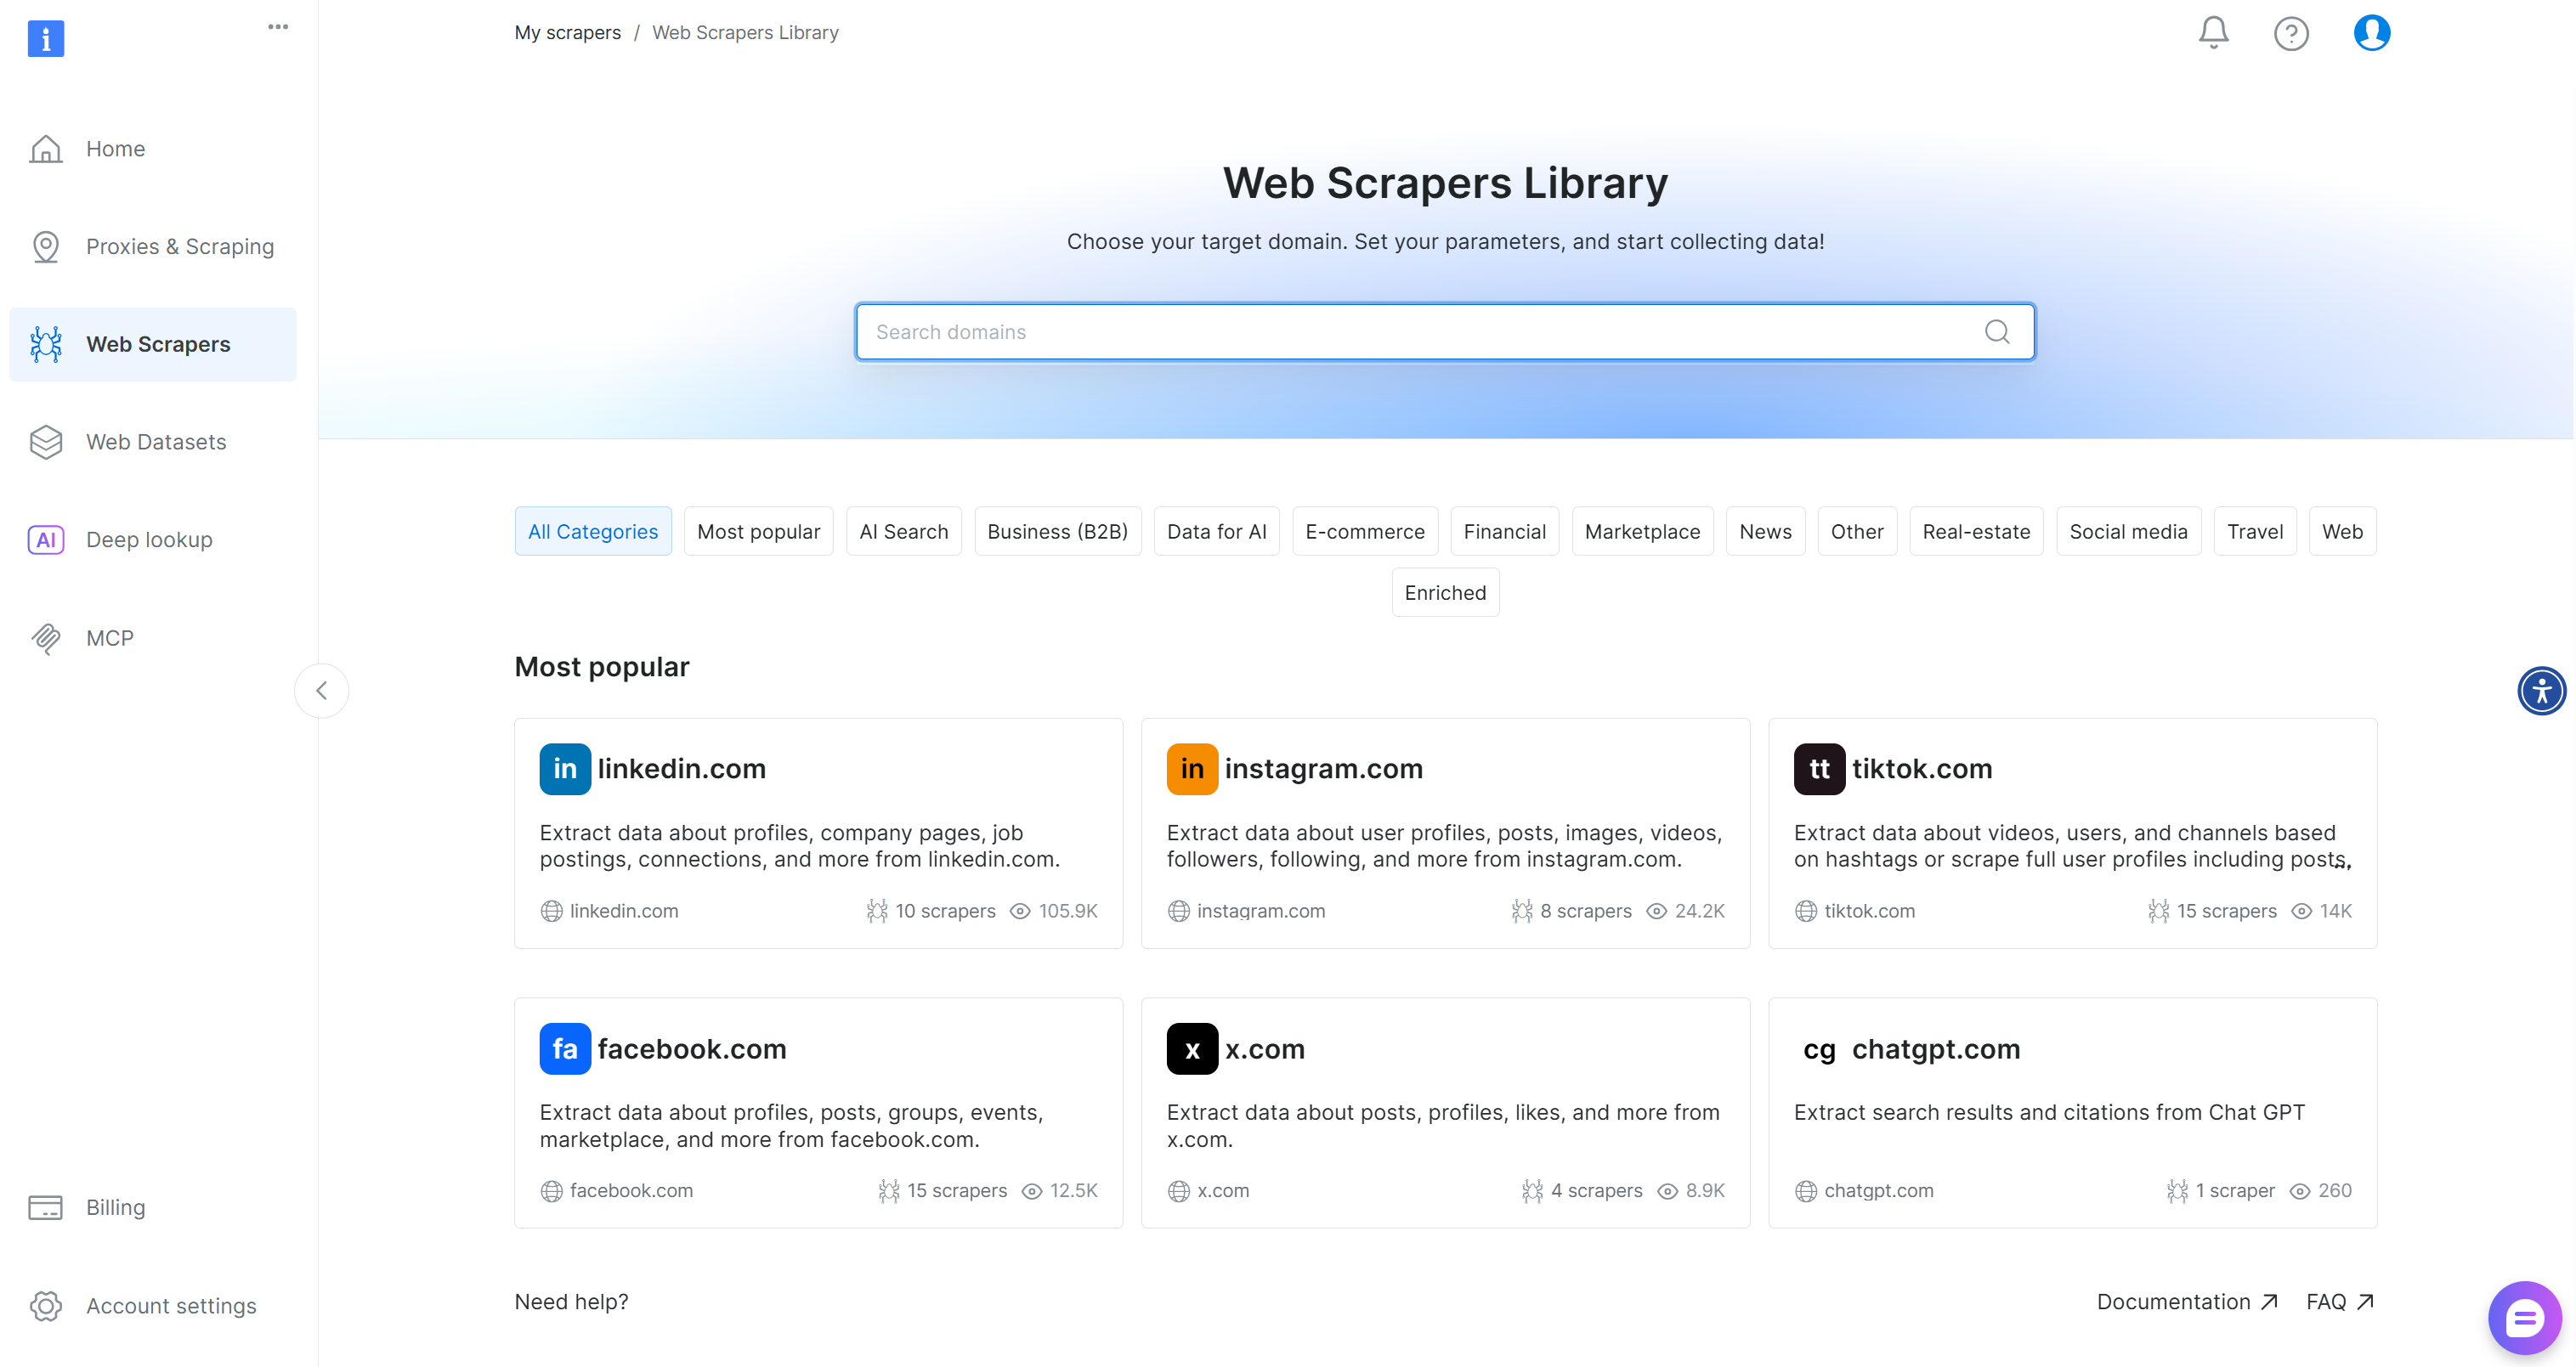
Search for “amazon” and select the “Amazon Reviews – collect by URL” scraper: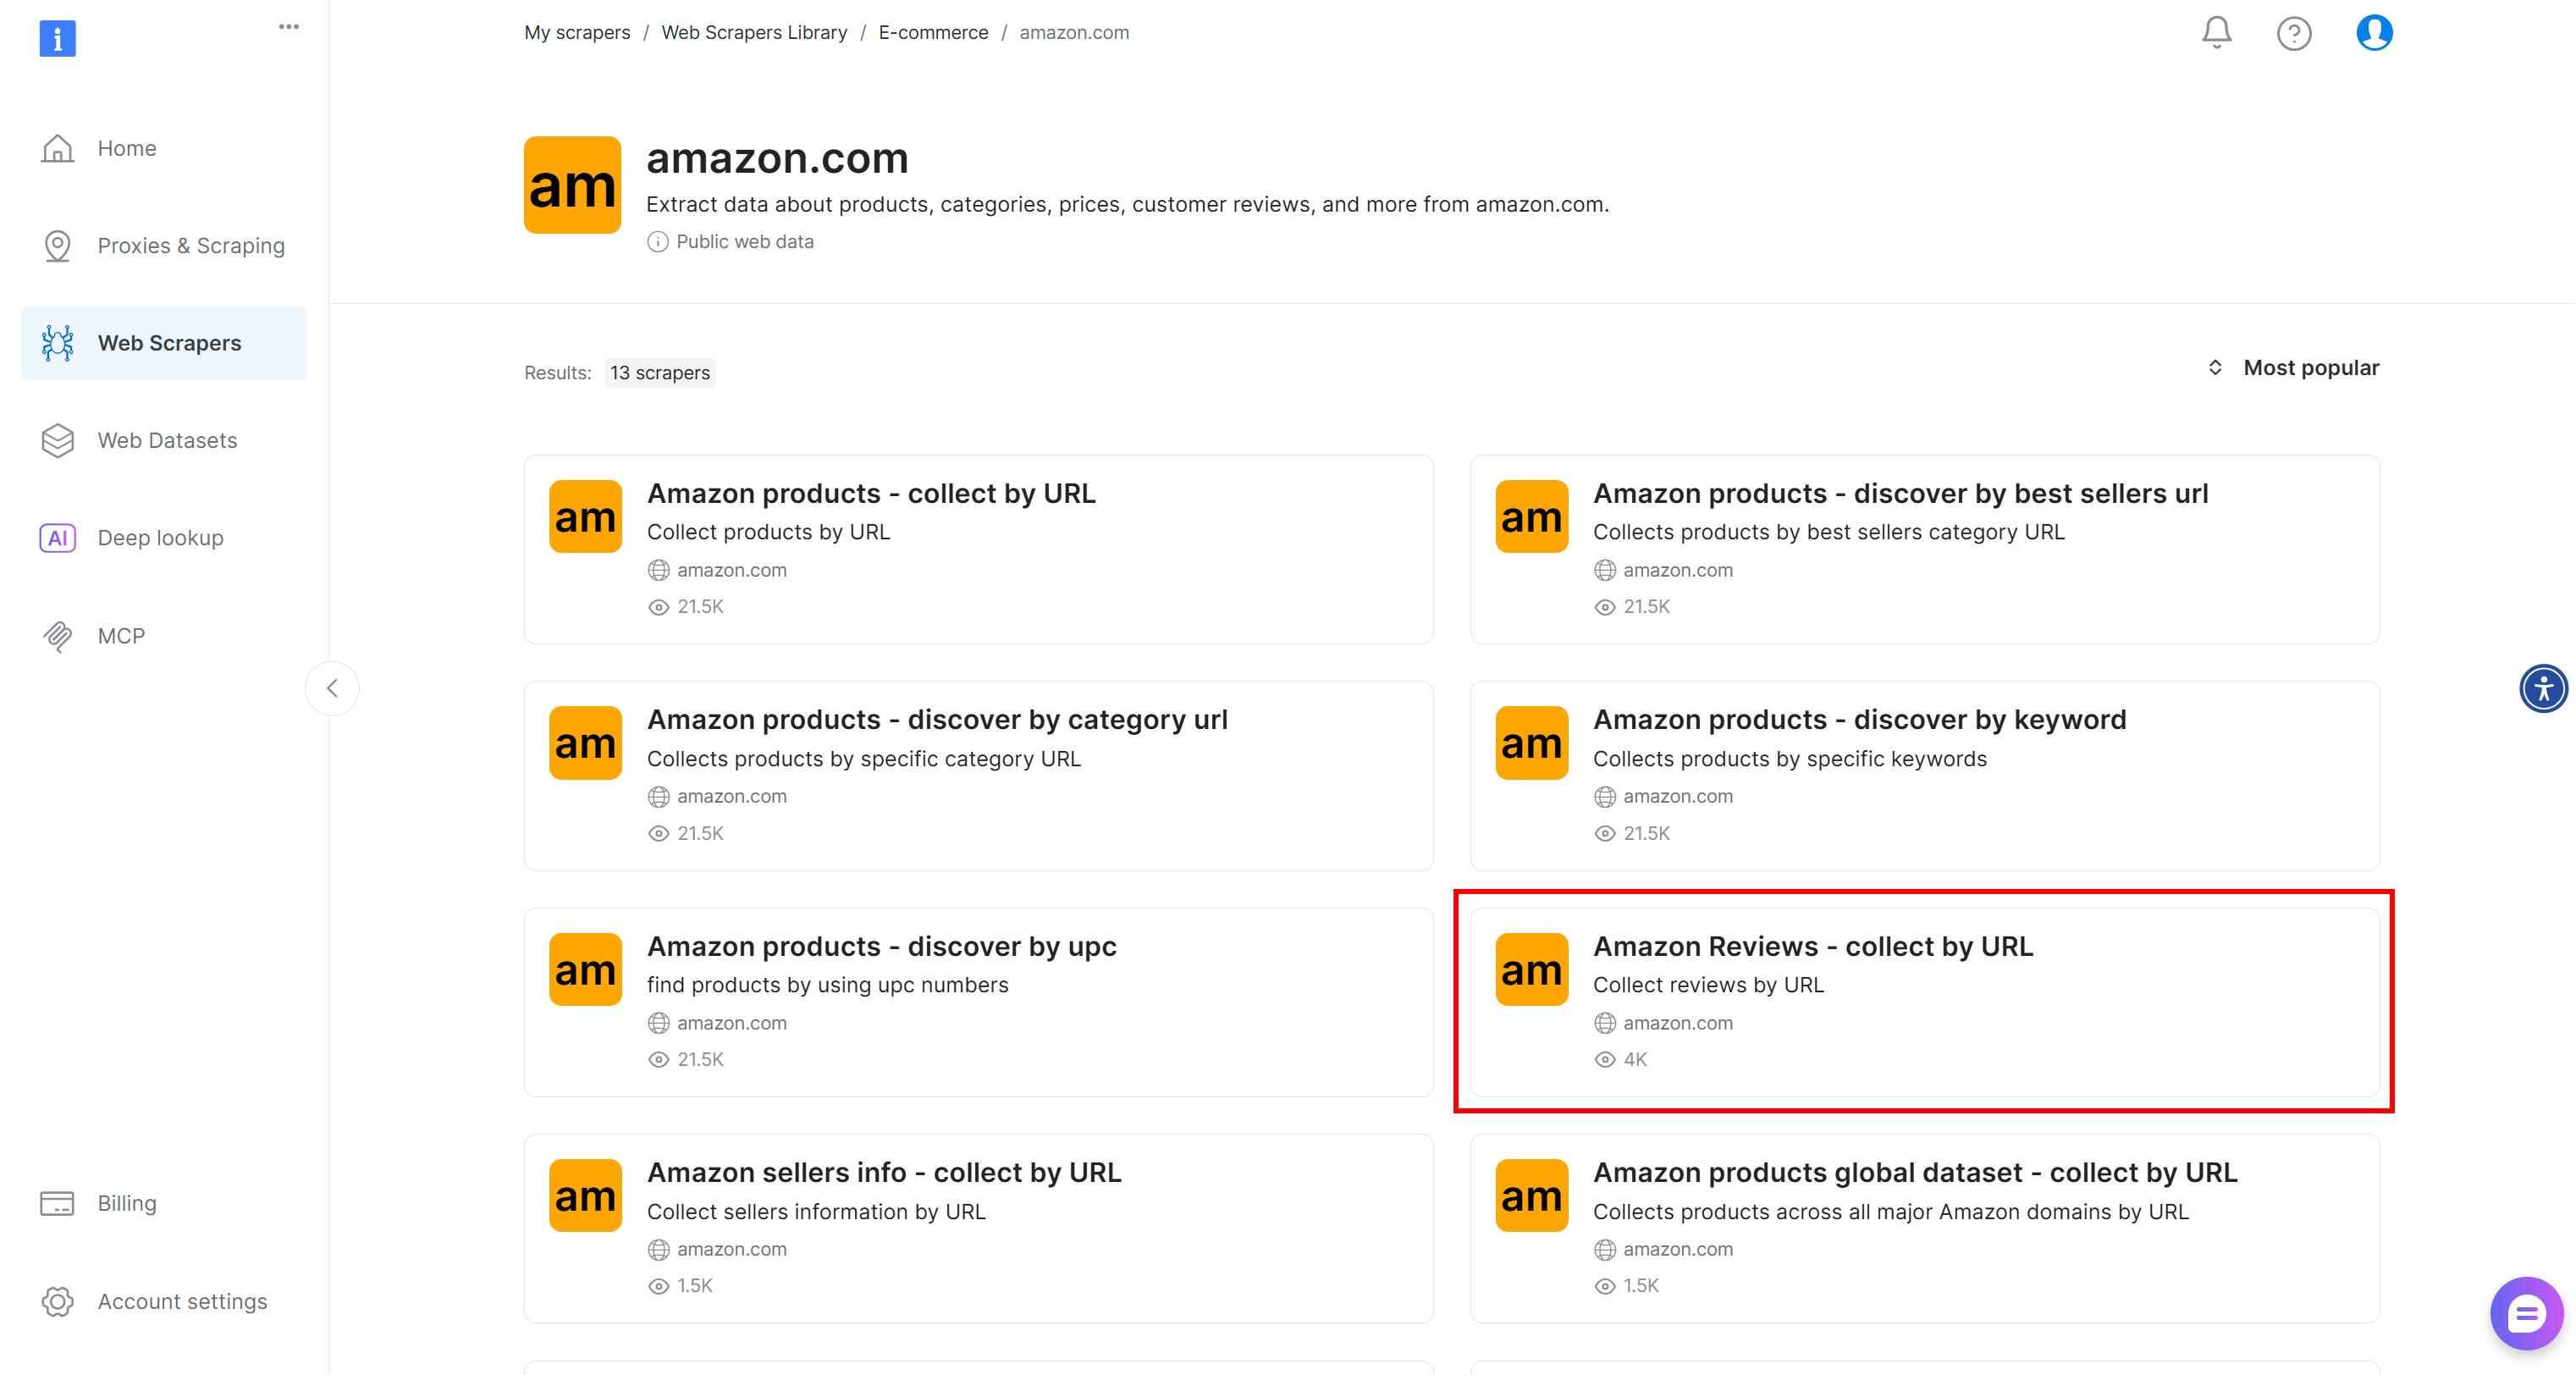
On this page, you can see how to generate integration-ready code or try the scraper directly via the no-code web application.
Select the “Scraper API” option, and you will reach the page below:
Here, review the supported input parameters and the output format. In particular, this dataset returns a list of Amazon reviews and has the ID gd_le8e811kzy4ggddlq.
To call this scraper via API, you must authenticate your requests using your Bright Data API key. If you do not have one, follow the official guide to generate it. Store it in a safe place, as you will need it shortly.
Great! You are now ready to use Bright Data’s Amazon Reviews scraper and retrieve product reviews data for analysis.
Step #4: Retrieve the Amazon Product Reviews Data
Create a new notebook cell and paste the following code:
BRIGHT_DATA_API_KEY = "<YOUR_BRIGHT_DATA_API_KEY>"  # Replace with your Bright Data API key

def trigger_snapshot(amazon_product_url):
    # Trigger the Bright Data Web Scraper API for a given Amazon product URL
    url = "https://api.brightdata.com/datasets/v3/trigger"

    params = {
        "dataset_id": "gd_le8e811kzy4ggddlq",  # ID of the "Amazon Reviews - collect by URL" scraper
        "include_errors": "true",
    }

    # Format input data for the API call
    data = [{"url": amazon_product_url}]

    headers = {
        "Authorization": f"Bearer {BRIGHT_DATA_API_KEY}",  # Authenticate the request
        "Content-Type": "application/json",
    }

    response = requests.post(url, headers=headers, params=params, json=data)

    if response.status_code == 200:
        snapshot_id = response.json()["snapshot_id"]
        print(f"Request successful! Snapshot ID: {snapshot_id}")
        return snapshot_id
    else:
        print(f"Request failed! Status code: {response.status_code}")
        print(response.text)


def poll_and_retrieve_snapshot(snapshot_id, output_file, format="csv", polling_timeout=20):
    # Poll the Bright Data Scraper API until the snapshot is ready, then save it
    snapshot_url = f"https://api.brightdata.com/datasets/v3/snapshot/{snapshot_id}?format={format}"
    headers = {"Authorization": f"Bearer {BRIGHT_DATA_API_KEY}"}

    print(f"Polling snapshot for ID: {snapshot_id}...")

    while True:
        response = requests.get(snapshot_url, headers=headers)

        if response.status_code == 200:
            print("Snapshot is ready. Downloading...")
            snapshot_data = response.text

            # Write the snapshot to a file
            with open(output_file, "w", encoding="utf-8") as file:
                file.write(snapshot_data)

            print(f"Snapshot saved to {output_file}")
            return
        elif response.status_code == 202:
            print(f"Snapshot not ready yet. Retrying in {polling_timeout} seconds...")
            time.sleep(polling_timeout)
        else:
            print(f"Request failed! Status code: {response.status_code}")
            print(response.text)
            break


# Amazon product URL to retrieve reviews from
amazon_product_url = "https://www.amazon.com/Drift-Car-Air-Freshener-Eliminator/dp/B0C1HJV7BJ/"

# Trigger snapshot and download reviews
snapshot_id = trigger_snapshot(amazon_product_url)
poll_and_retrieve_snapshot(snapshot_id, "product-reviews.csv")
Replace the placeholder <YOUR_BRIGHT_DATA_API_KEY> with your actual Bright Data API key generated earlier.
The above code:
- Triggers the reviews scraper using
datasets/v3/trigger, which starts a scraping job on Bright Data’s cloud using the Amazon Reviews scraper. - Polls for the generated dataset snapshot using
datasets/v3/snapshot/{snapshot_id}, waiting until Bright Data finishes scraping the reviews. - Exports the final data as a CSV (because
format="csv"is specified) and saves it locally toproduct-reviews.csv.
This is exactly how the Web Scraper API workflow operates. For more details, consult the official Bright Data documentation.
When you run the code block, you should see something similar to: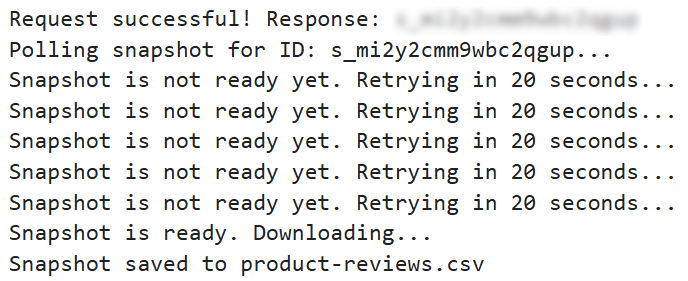
Then, a product-reviews.csv file will appear in your project folder. Open it and you will see the scraped reviews in structured format: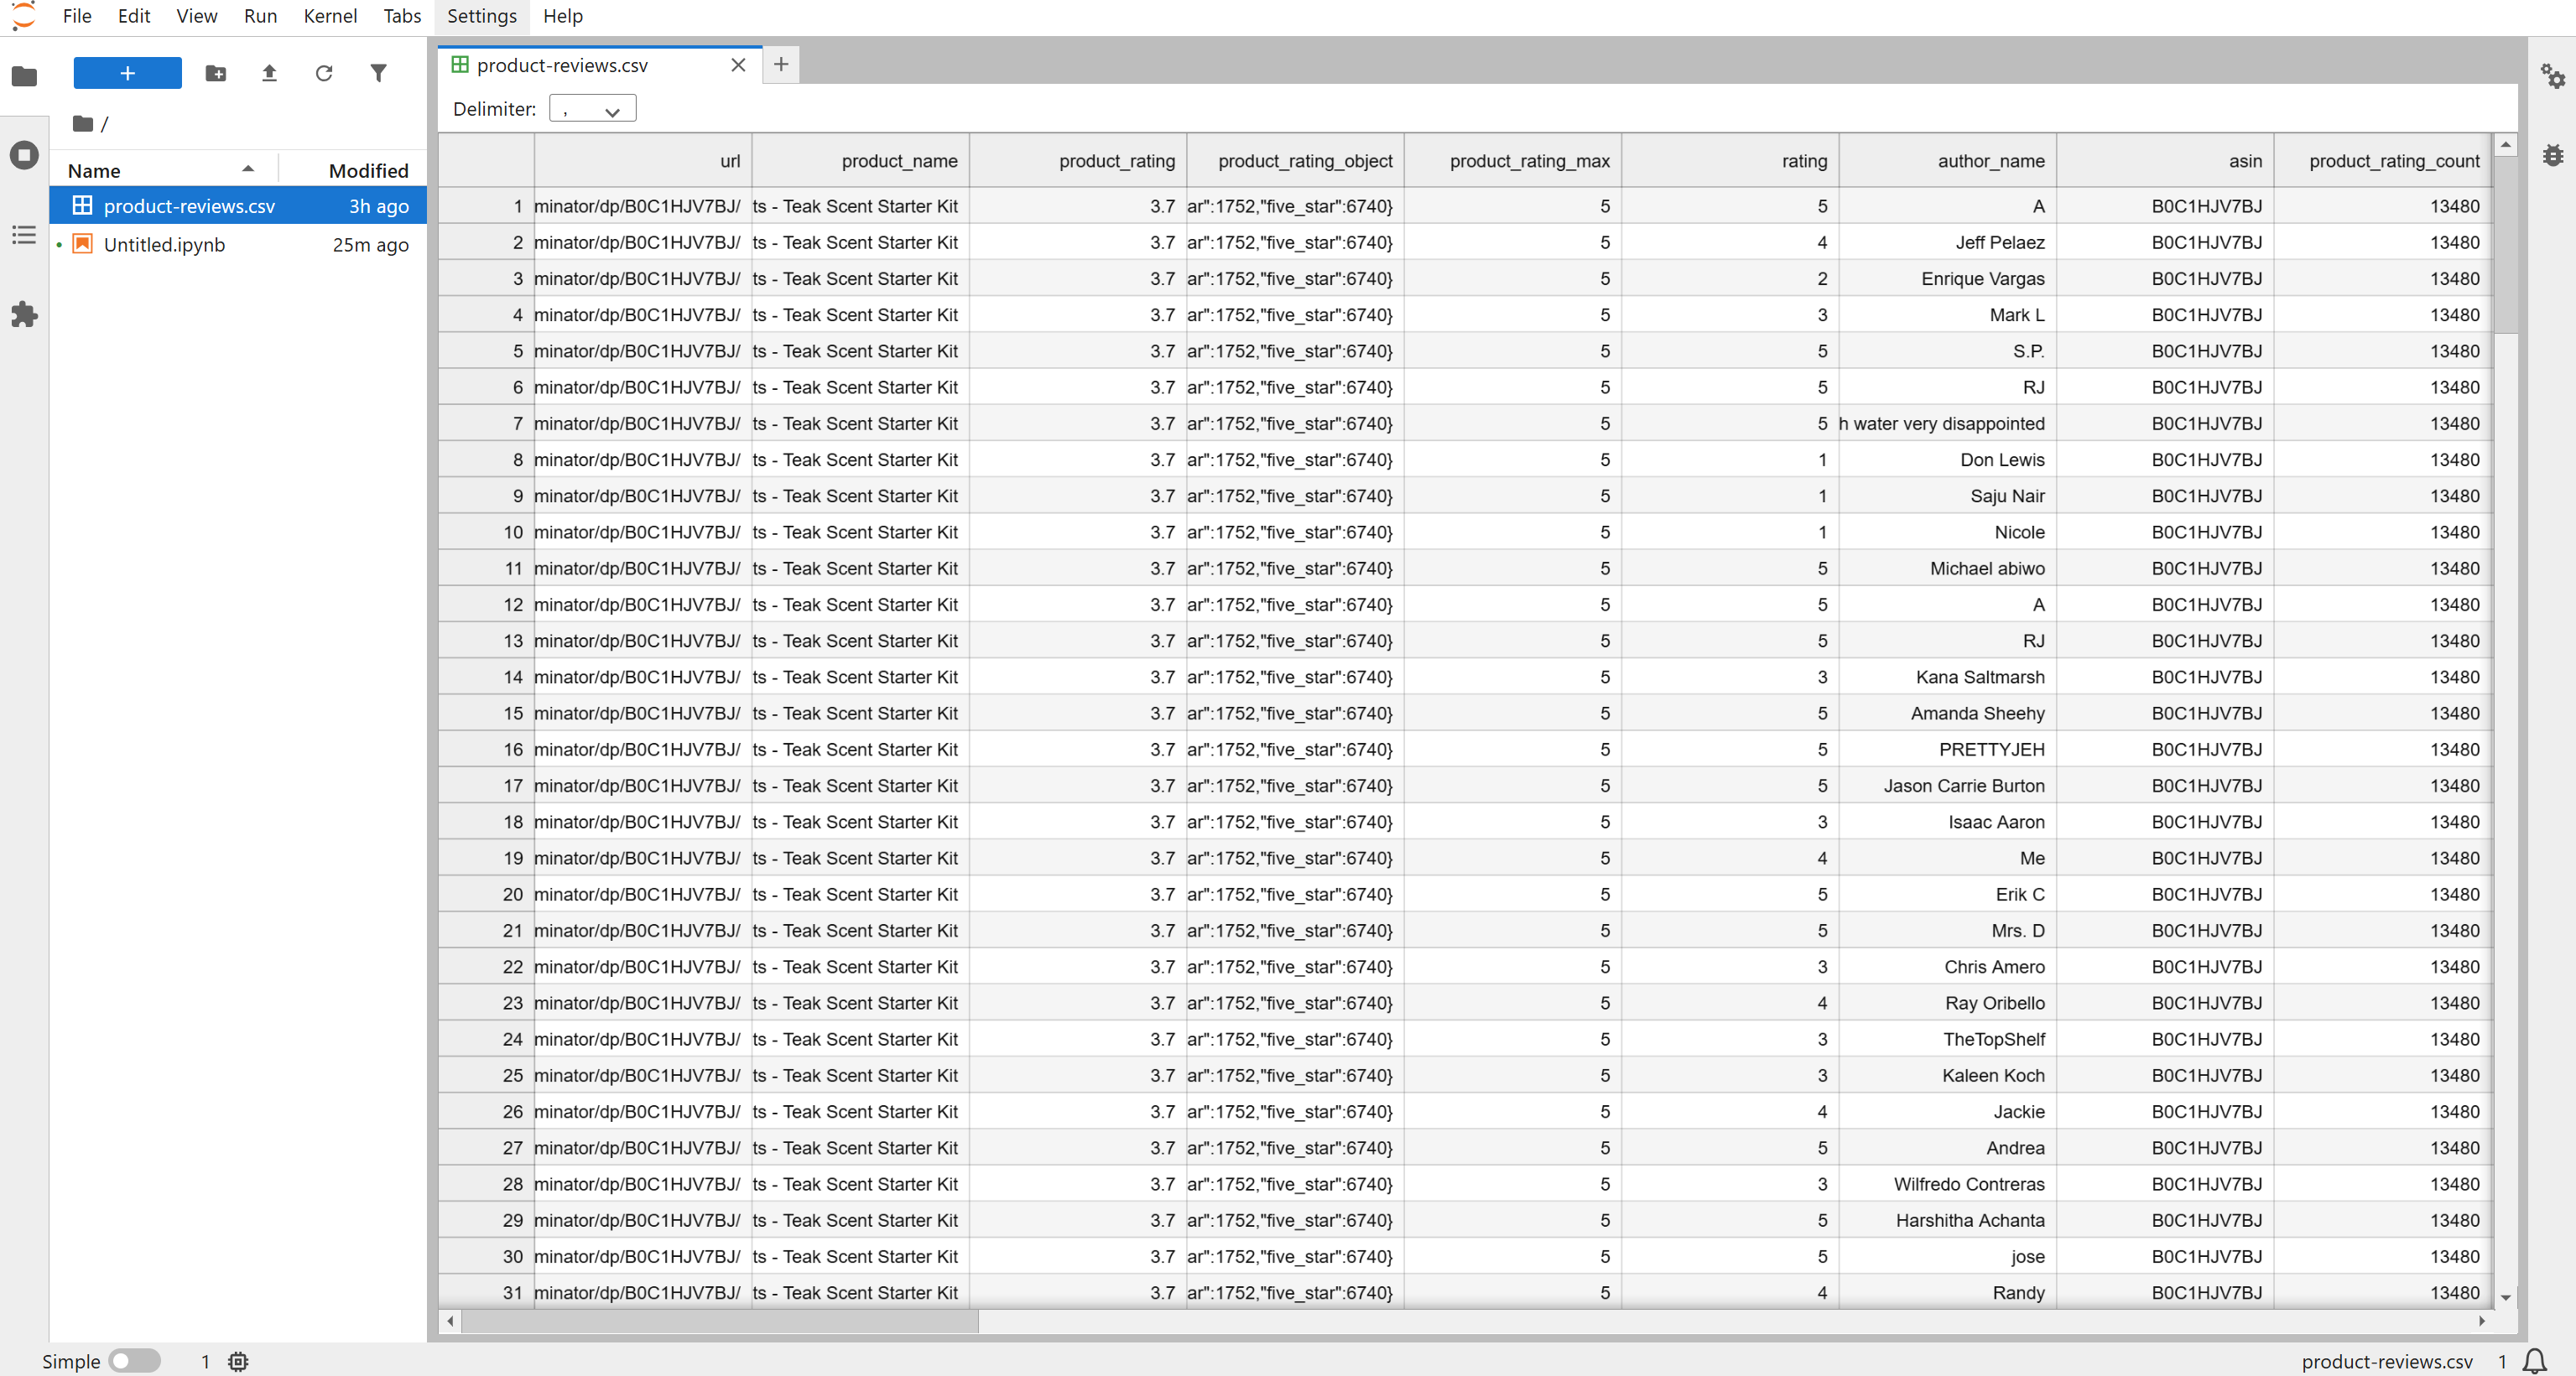
By default, the scraper returns the latest ~200 reviews, but you can adjust the API inputs to get more if needed. For this tutorial, the 196 reviews retrieved are more than enough to complete the sentiment analysis pipeline.
Cool! You now have fresh Amazon product review data ready for TensorFlow analysis.
Step #5: Explore the Scraped Data
Start by loading the scraped data from the product-reviews.csv file:
# Load product reviews from the CSV file generated via Bright Data
df = pd.read_csv("product-reviews.csv")

# Convert review posted dates to datetime
df["date"] = pd.to_datetime(df["review_posted_date"])

# Drop reviews with missing text
df = df.dropna(subset=["review_text"])

# Sort reviews by publication date (ascending)
df = df.sort_values(by="date", ascending=True)

print(f"Loaded {len(df)} reviews.")
Run this cell, and you will see the total number of loaded reviews:
Loaded 196 reviews.Next, analyze the distribution of ratings:
print(df["rating"].value_counts())You should get something similar to:
rating
1    74
2    31
3    16
4    12
5    63
As shown above, the reviews are fairly evenly distributed across the 1–5-star range. To better visualize this distribution, use a bar chart with Matplotlib:
# Compute the number of reviews per rating (1–5 stars)
rating_counts = df["rating"].value_counts().sort_index()

# Plot the rating distribution as a bar chart
colors = plt.cm.RdYlGn(np.linspace(0, 1, len(rating_counts)))
plt.bar(
    rating_counts.index,
    rating_counts.values,
    color=colors,
    edgecolor="black",
    width=0.6,
    align="center"
)

plt.title("Rating Distribution (1–5 stars)")
plt.xlabel("Stars")
plt.ylabel("Count")
plt.xticks(rating_counts.index)
plt.grid(axis="y", linestyle="--", alpha=0.5)
plt.show()
You will get a chart similar to the one below: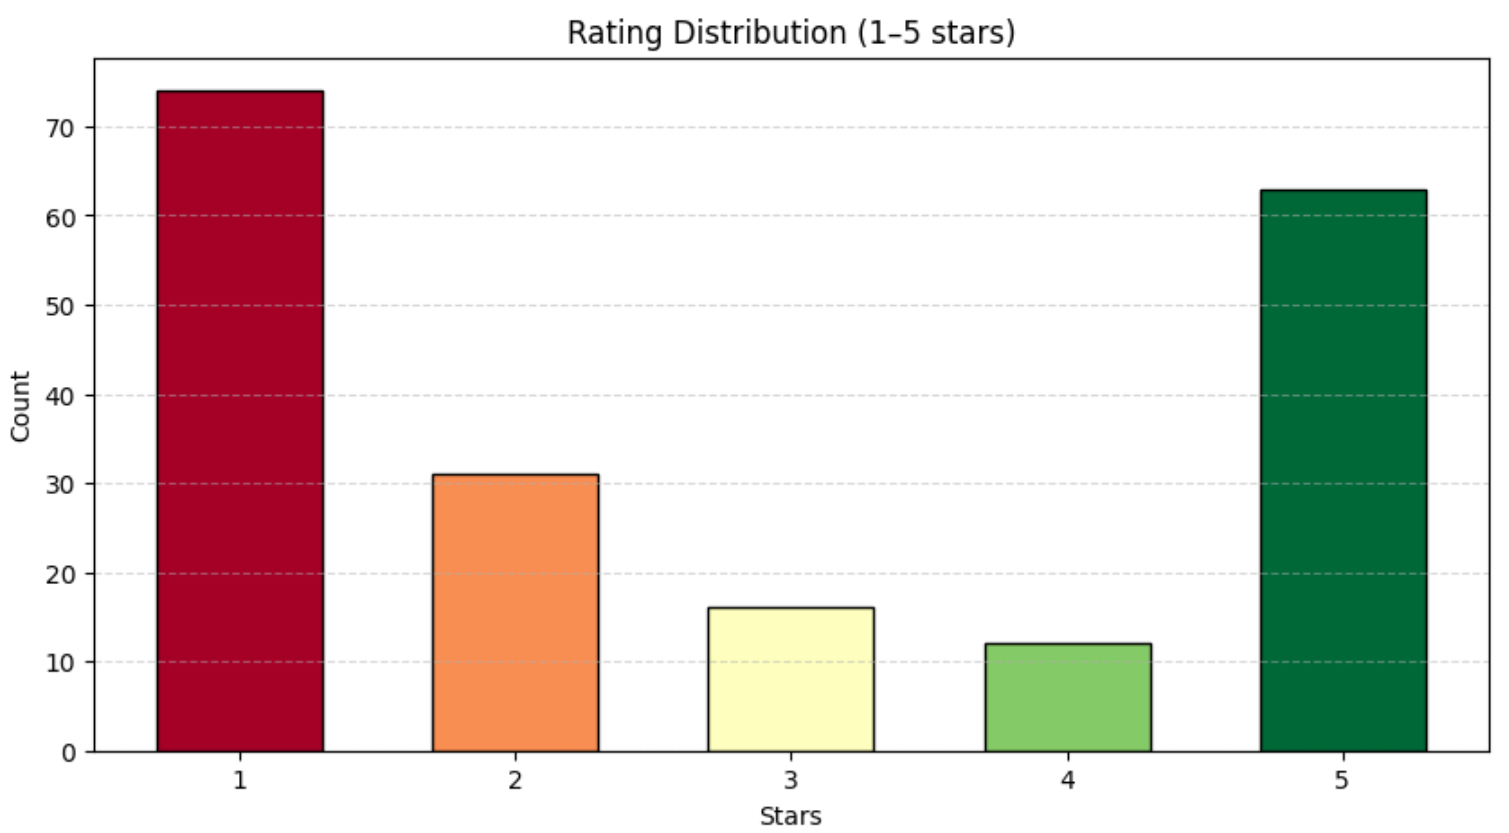
Perfect! You now have a clear, high-level understanding of the Amazon review dataset you just fetched. This foundation is essential before moving on to model training and sentiment analysis.
Step #6: Assign a Sentiment Analysis Score to the Reviews
Before applying machine learning, it helps to simplify the sentiment classification task by ignoring the 3-star reviews. That is because those reviews are usually neutral, and they do not clearly express positive or negative sentiment.
Keeping them would force the model to learn a three-class problem (positive / neutral / negative), which requires more data and more complex modeling. Instead, we are going to convert the task into a binary sentiment classification by considering:
- 4–5 star reviews as “positive” (
1); - 1–2 star reviews as “negative” (
0).
Given that, implement the sentiment analysis logic in TensorFlow as follows:
# Drop neutral reviews (rating=3) for binary sentiment clarity
df = df[df["rating"] != 3]

# Map ratings to sentiment: 1=positive (>=4), 0=negative (<4)
df["sentiment_label"] = np.where(df["rating"] >= 4, 1, 0)

# Load Universal Sentence Encoder embeddings
print("Loading Universal Sentence Encoder embeddings...")
use = hub.load("https://tfhub.dev/google/universal-sentence-encoder/4")
X_emb = np.array(use(df["review_text"].tolist()).numpy(), dtype=np.float32)  # fixed float32
y = df["sentiment_label"].values

# Split dataset into training and validation sets
X_train, X_val, y_train, y_val = train_test_split(
    X_emb, y, test_size=0.2, random_state=42, stratify=y
)

# Compute class weights to handle class imbalance
classes = np.unique(y_train)
class_weights = compute_class_weight("balanced", classes=classes, y=y_train)
class_weights = dict(zip(classes, class_weights))

# Build a simple dense classifier with Input layer first
model = Sequential([
    Input(shape=(X_emb.shape[1],)),
    Dense(128, activation="relu"),
    Dropout(0.3),
    Dense(64, activation="relu"),
    Dense(1, activation="sigmoid")
])

model.compile(optimizer="adam", loss="binary_crossentropy", metrics=["accuracy"])

# Force model to build to avoid retracing
_ = model(X_emb[:1])

# Train the model
history = model.fit(
    X_train, y_train,
    validation_data=(X_val, y_val),
    epochs=20,
    batch_size=16,
    class_weight=class_weights,
    verbose=1
)

# Predict on validation set and evaluate
y_pred = (model.predict(X_val, batch_size=32) > 0.5).astype(int)
print("nSentiment Model Classification Report:")
print(classification_report(y_val, y_pred))

# Predict on full dataset and save sentiment scores
df["sentiment_score"] = model.predict(X_emb, batch_size=32).flatten()
This code block relies on the Universal Sentence Encoder to convert each review into a semantic vector. If you are unfamiliar with that model, Universal Sentence Encoder is a model from Google that converts text into 512-dimensional embedding vectors for natural language processing tasks, such as classification, semantic similarity, and others.
Those embeddings capture meaning such as tone, sentiment, and intent expressed in each review. Then, the Keras Sequential model uses fully connected (Dense) layers to learn patterns in the embeddings that distinguish positive from negative sentiment. Its output is a probability score, where:
- Values close to
1.0indicate positive sentiment; - Values close to
0.0indicate negative sentiment.
The model assigns one of these scores to every review. The classification report from the validation set is:
Sentiment Model Classification Report:
              precision    recall  f1-score   support

           0       0.91      0.95      0.93        21
           1       0.93      0.87      0.90        15

    accuracy                           0.92        36
   macro avg       0.92      0.91      0.91        36
weighted avg       0.92      0.92      0.92        36
This shows that:
- The model reaches 92% accuracy on unseen validation data.
- Precision and recall are consistently strong for both positive and negative classes.
- Training and validation accuracy are close, which indicates the model is not significantly overfitting.
To better visualize the machine-learning training process, consider adding a chart like the one below:
plt.plot(history.history["accuracy"], label="Train Accuracy")
plt.plot(history.history["val_accuracy"], label="Validation Accuracy")
plt.title("Sentiment Model Training Performance")
plt.xlabel("Epoch")
plt.ylabel("Accuracy")
plt.legend()
plt.grid(True, linestyle="--", alpha=0.5)
plt.show()
This will show the full training history: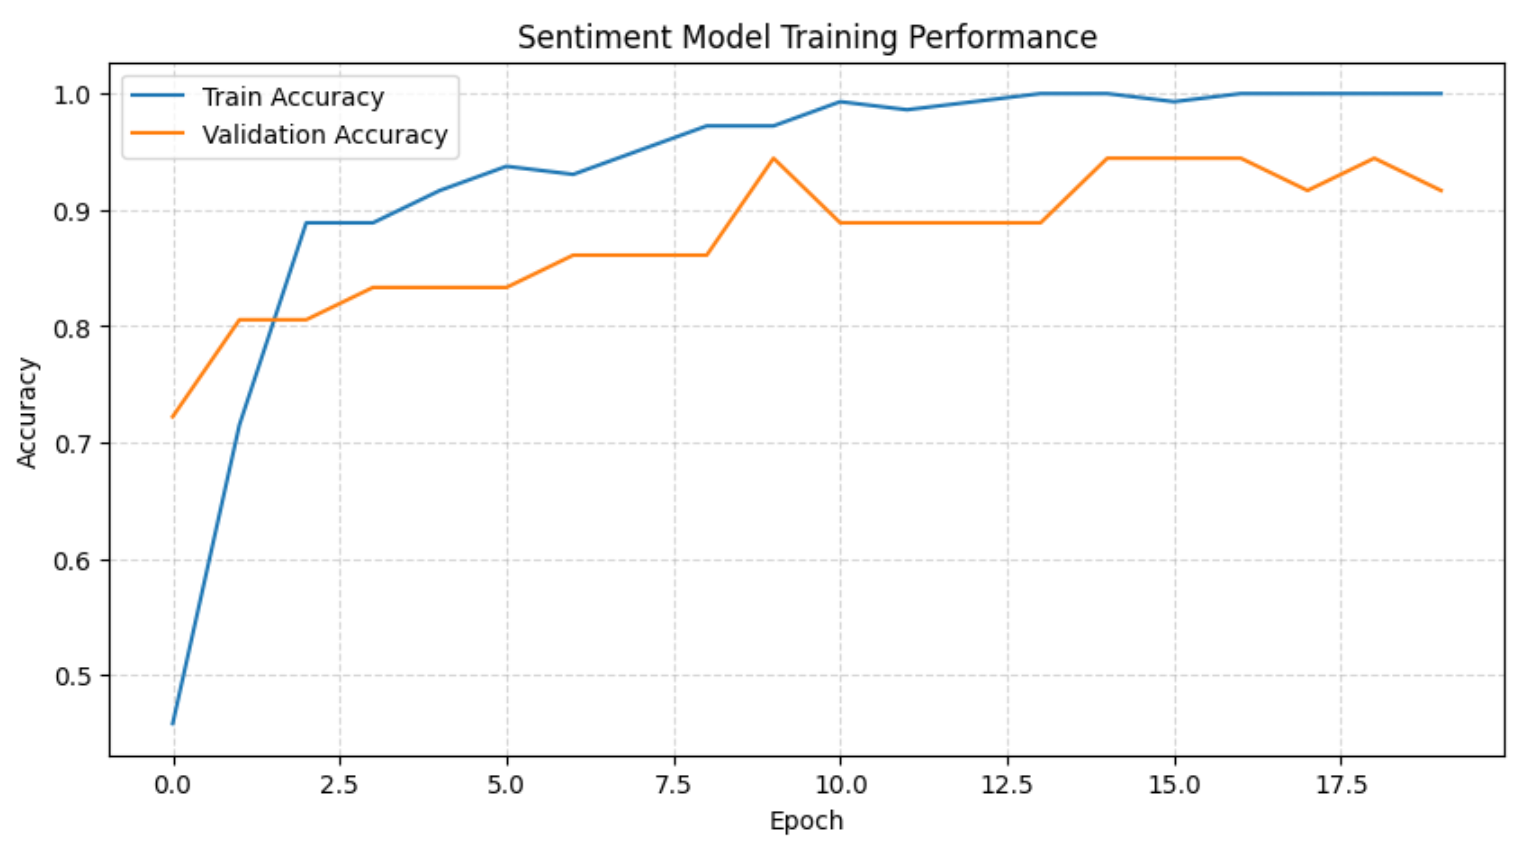
The above chart, together with the training logs, shows that the model quickly learns the sentiment boundary within the first few epochs before stabilizing with strong validation accuracy. As training progresses, accuracy on the training set reaches 100%, while validation accuracy remains consistently high, indicating only mild and acceptable overfitting given the dataset size.
Lastly, visualize the predicted sentiment probabilities:
plt.hist(df["sentiment_score"], bins=20, edgecolor="black", color="skyblue")
plt.title("Predicted Sentiment Score Distribution")
plt.xlabel("Sentiment Score")
plt.ylabel("Count")
plt.grid(axis="y", linestyle="--", alpha=0.5)
plt.show()
The result will be: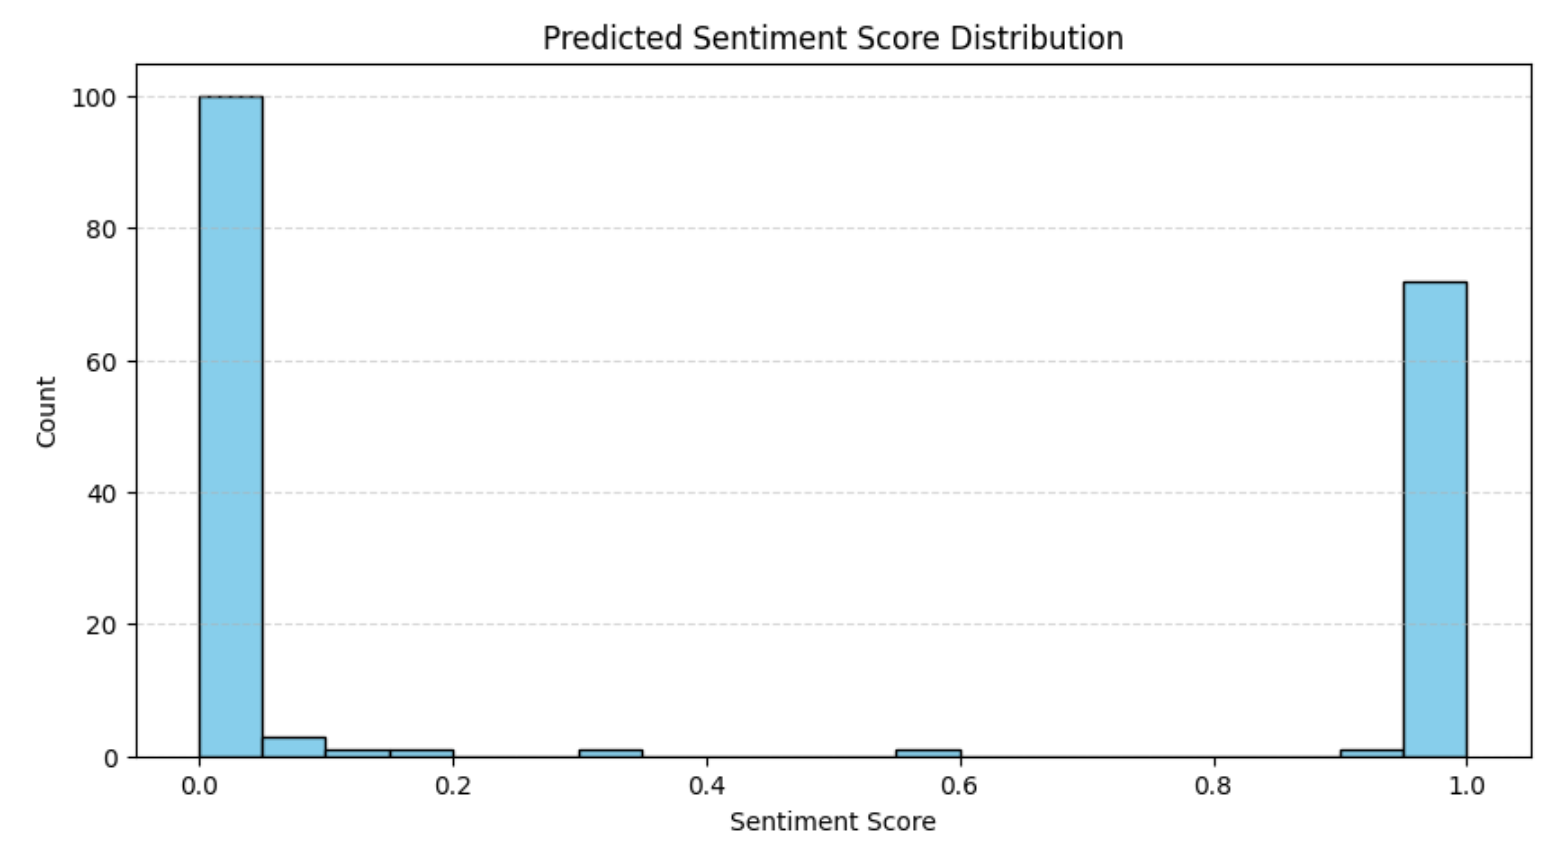
The distribution aligns with what we observed earlier in the rating analysis, i.e., most reviews are either strongly positive or strongly negative. This pattern is common in e-commerce platforms, where polarized opinions tend to dominate.
Fantastic! Sentiment analysis completed.
Step #7: Study the Sentiment Analysis Over Time
Now that every review has a sentiment score, visualize how customer sentiment has evolved over the past year. Apply a 7-day rolling trend on the daily average sentiment to smooth out day-to-day noise:
# Prepare daily average sentiment
daily = df.groupby(df["date"].dt.date)["sentiment_score"].mean().reset_index()
daily["date"] = pd.to_datetime(daily["date"])
daily = daily.sort_values("date")

# Filter to last year
one_year_ago = daily["date"].max() - pd.DateOffset(years=1)
daily_last_year = daily[daily["date"] >= one_year_ago]

# Compute 7-day rolling trend
trend = daily_last_year["sentiment_score"].rolling(window=7, min_periods=1).mean()

# Set one x-axis label per month
monthly_labels = pd.date_range(
    start=daily_last_year["date"].min(),
    end=daily_last_year["date"].max(),
    freq="MS"  # Month Start
)

# Plot daily sentiment and rolling trend
plt.bar(daily_last_year["date"], daily_last_year["sentiment_score"], color="skyblue", label="Daily Sentiment")
plt.plot(daily_last_year["date"], trend, color="red", linewidth=2, label="7-Day Rolling Trend")

# Set x-axis labels
plt.xticks(ticks=monthly_labels, labels=[d.strftime("%Y-%m") for d in monthly_labels], rotation=45)

plt.title("Daily Average Sentiment (Last Year) + Trend")
plt.xlabel("Date")
plt.ylabel("Sentiment Score")
plt.ylim(0,1)
plt.legend()
plt.grid(True, axis="y", linestyle="--", alpha=0.5)
plt.tight_layout()
plt.show()
This produces the sentiment-over-time chart below: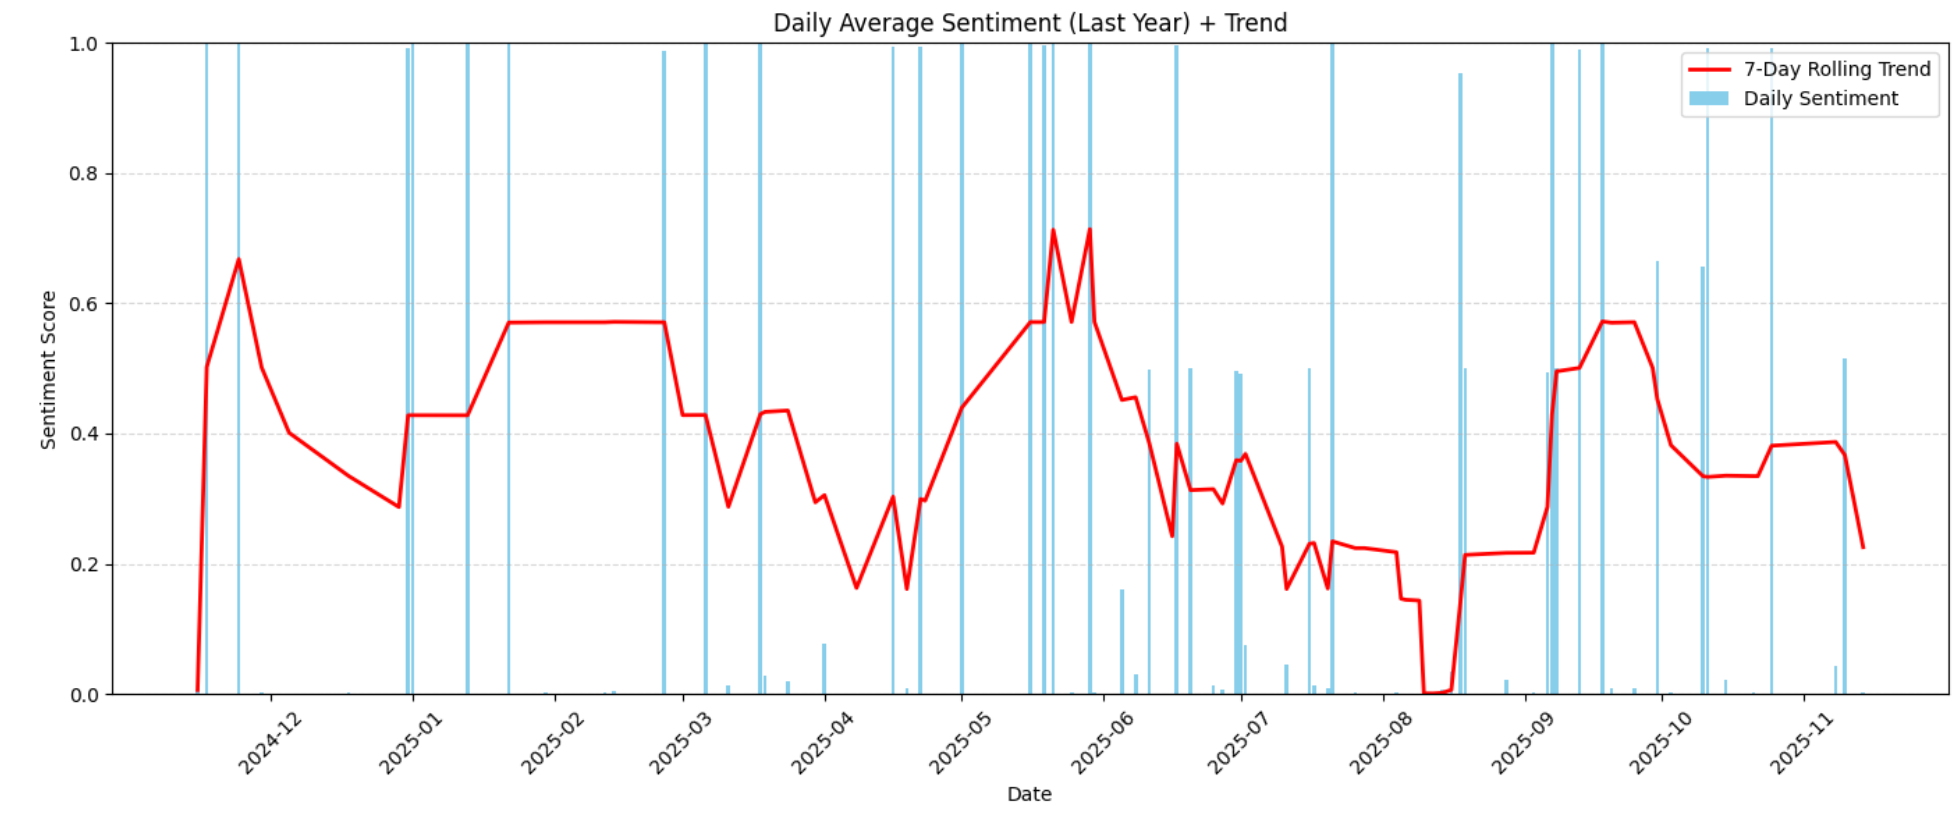
The visualization highlights growing or declining sentiment patterns across the year. These trends help you recognize when customer satisfaction improved, dropped, and whether any external factors (product changes, delays, defects, price updates) may have caused shifts in sentiment.
For example, in the chart, you can clearly see that between June 2026 and mid-August 2026, sentiment fell sharply, going from moderately positive (around 0.6) to extremely negative (near 0.0):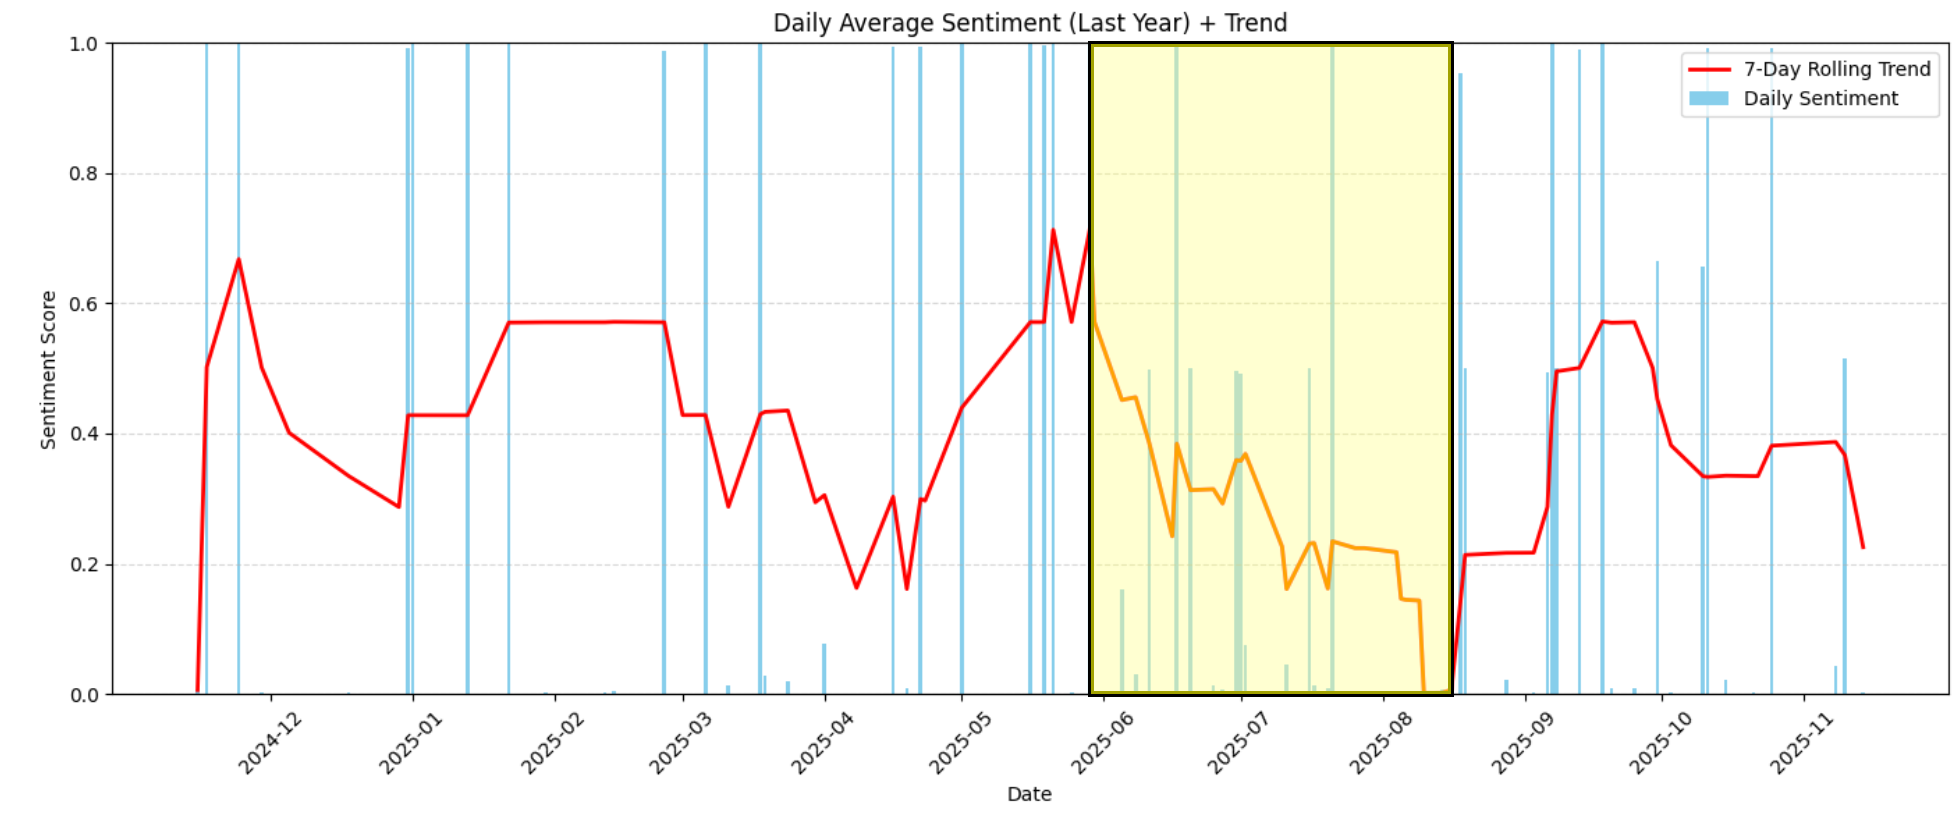
To understand what happened during this period, restrict the dataset to those dates:
# Filter reviews between June 2026 and mid-August 2026
start_date = pd.Timestamp("2026-06-01")
end_date = pd.Timestamp("2026-08-15")
df_filtered = df[(df["date"] >= start_date) & (df["date"] <= end_date)]
print(f"Number of reviews in period: {len(df_filtered)}")
As the output shows, there are 34 reviews in that interval:
Number of reviews in period: 34Next, summarize how sentiment is distributed across ratings:
rating_summary = df_filtered.groupby("rating")["sentiment_score"].agg(["count", "mean"]).reset_index()
rating_summary.rename(columns={"count":"num_reviews", "mean":"avg_sentiment"}, inplace=True)
print("nRating summary:")
print(rating_summary)
The result would be:
Rating summary:
   rating  num_reviews  avg_sentiment
0       1           16       0.004767
1       2           11       0.048928
2       4            2       0.998977
3       5            5       0.993221
This tells us that 27 out of 34 reviews were 1- or 2-star, and their sentiment scores are extremely close to 0.0.
Plot the relationship between ratings and sentiment:
# Plot sentiment vs rating in a chart
fig, ax1 = plt.subplots(figsize=(10,6))

ax1.bar(rating_summary["rating"], rating_summary["num_reviews"], color="skyblue", label="Number of Reviews")
ax1.set_xlabel("Rating")
ax1.set_ylabel("Number of Reviews", color="skyblue")
ax1.tick_params(axis="y", labelcolor="skyblue")

ax2 = ax1.twinx()
ax2.plot(rating_summary["rating"], rating_summary["avg_sentiment"], color="red", marker="o", label="Average Sentiment")
ax2.set_ylabel("Average Sentiment Score", color="red")
ax2.tick_params(axis="y", labelcolor="red")
ax2.set_ylim(0,1)

fig.suptitle("Sentiment Analysis vs Rating (2026-06-01 to 2026-08-15)")
fig.tight_layout()
plt.show()
The resulting chart will be: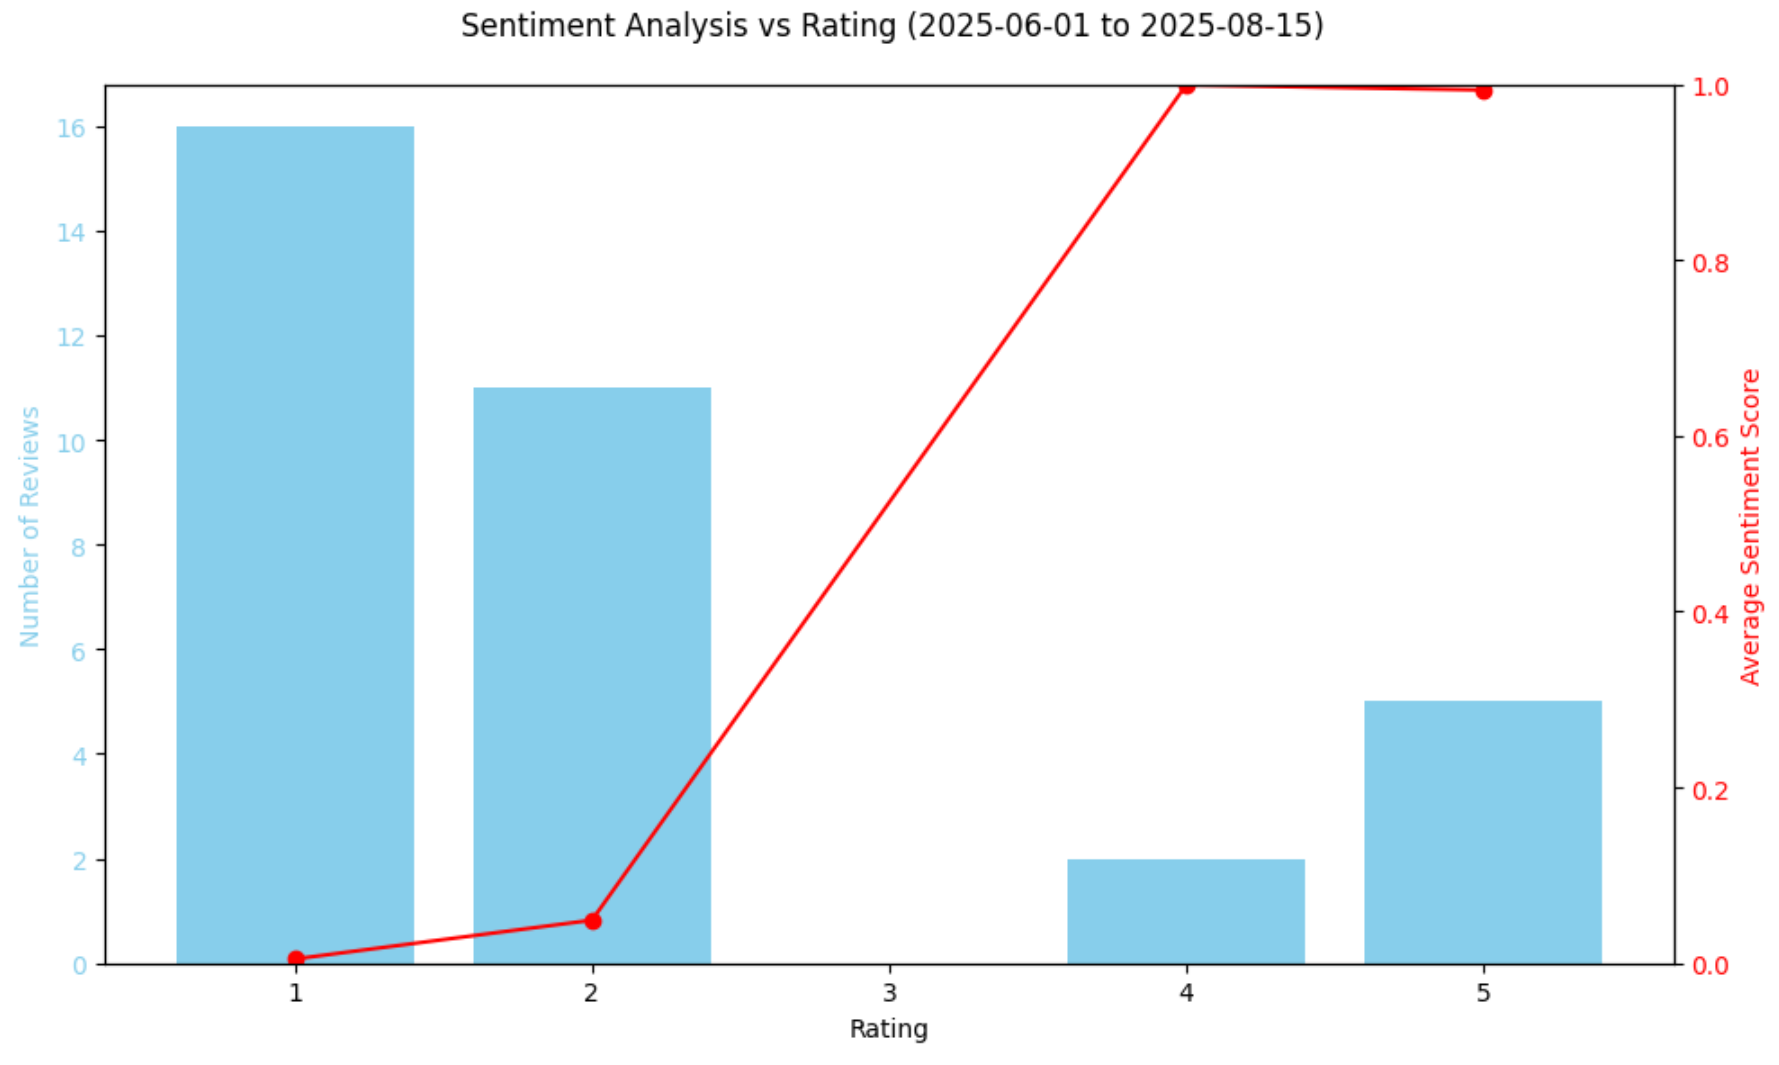
The above chart confirms the sharp sentiment drop, with most reviews in that period being utterly negative. Interestingly, the model slightly ranks 4-star reviews more positively than 5-star reviews via its sentiment analysis scores. This is not a mistake, as it reflects that a star rating alone does not always reflect emotional tone. Some 5-star reviews may still contain concerns, while some 4-star reviews may express extremely positive language.
After all, even though star ratings give a quick idea of how customers feel, they do not always capture the full nuance of the review text. By comparing the sentiment scores predicted by the model with the numeric ratings, you can see whether the language in the reviews aligns with the assigned stars. This helps identify anomalies, such as negative wording in otherwise high-rated reviews, or subtle positivity in lower-rated reviews.
Let’s continue analyzing this interesting identified pattern in the decreasing review scores!
Step #8: Read the Relevant Reviews
The final step to truly realize what happened during the June 2026 to mid-August 2026 decline in reviews is to inspect them directly. Achieve that with:
# Select relevant columns
df_table = df_filtered[["date", "review_text", "rating", "sentiment_score"]]

# Display the table in notebook via HTML
display(HTML(df_table.to_html(index=False)))
The result will be the following HTML table:
As you can tell, most reviews during this period complain that the scent disappears quickly or is not strong enough. That highlights potential production issues in the shipped products over those weeks.
That insight is extremely valuable as it allows you to investigate the production process, address recurring problems, and potentially reach out to dissatisfied customers with solutions such as vouchers or discounts.
Note: This review analysis process could also be automated further using an LLM, making it a fully autonomous, production-ready pipeline.
Et voilà! Thanks to Bright Data’s scraping capabilities, you retrieved Amazon product data. Then, you applied TensorFlow for sentiment analysis, studied the trends, and identified the reasons behind the drop in reviews within a specific timeframe.
Conclusion
In this article, you saw how to retrieve review data from an Amazon product via Bright Data and process it to identify sentiment analysis trends using machine learning workflows built with TensorFlow in a Python notebook.
The project presented here meets the needs of small to medium businesses or enterprises looking for ways to monitor user reviews and improve customer satisfaction. Such analysis would not be possible without the data services offered by Bright Data for enterprises.
Those solutions include a rich dataset marketplace and web scraper APIs that help you collect past or freshly updated data from over 100 domains, including Amazon, LinkedIn, Yahoo Finance, and many others. Given that data, you can feed it into TensorFlow or similar technologies to analyze it via machine learning.
Create a free Bright Data account today to try our scraper APIs or explore our datasets!

Technical Writer
Antonello Zanini is a technical writer, editor, and software engineer with 5M+ views. Expert in technical content strategy, web development, and project management.