Data filtering used to be a simple database trick. Today, it’s a core business capability that powers AI, keeps you compliant, and helps you outpace competitors.
In this guide, you’ll learn:
- What data filtering is.
- Why data filtering is important.
- Why you should use automated data filtering.
- How Deep Lookup makes data filtering easy.
Let’s dive in!
What is Data Filtering?
Data filtering is simply showing yourself only the data you actually care about. Think of it like using a coffee filter that gives yo just the good stuff you want, not the grounds. The mechanics are straightforward: you set rules (e.g show me customers in California), and the system excludes everything that doesn’t match the rules.
We all use data filtering in our everyday lives. When you search for “wireless headphones under $100” on Amazon, you’re filtering. When your marketing team pulls a list of customers who haven’t purchased in 6 months, they’re filtering. When you sort your inbox by sender, you’re filtering.
While the concept is straightforward, using data filtering at scale in an organization requires a solid understanding of your data and the right tools. Today, data filtering matters for the success of every organization, and we’ll tell you exactly why.
Why Data Filtering Matters
Filtering is a necessity for making sense of big data.
Most companies today are sitting on goldmines of data they’ll never use. Not because the data isn’t valuable, but because they can’t efficiently dig through it to find what matters.
Think about it this way. Your company probably collects hundreds of data points about each customer. But when crunch time comes and you need to identify your most valuable segments, are you really going to manually sort through 50,000 customer records? Of course not. You’ll take a sample, make some educated guesses, and hope for the best.
That’s exactly the problem filtering solves. Here’s why effective data filtering is essential:
- Cut through the noise: Your analysts stop wasting time on irrelevant data and focus on patterns that actually move the needle.
- Speed up everything: Smaller datasets mean faster queries, quicker insights, and decisions that happen in days instead of weeks.
- Uncover hidden patterns: When you remove the clutter, trends that were invisible suddenly become obvious.
- Save actual money: Less data to store and process means lower infrastructure costs. Plus, your team’s time becomes infinitely more valuable.
- Stay compliant: Filter out sensitive information automatically, and you’ll sleep better knowing you’re not accidentally exposing customer data.
In summary, data filtering is the bridge between raw data and informed decision-making. Next, we’ll look at how to approach filtering in practice and some standard techniques for effective filtering.
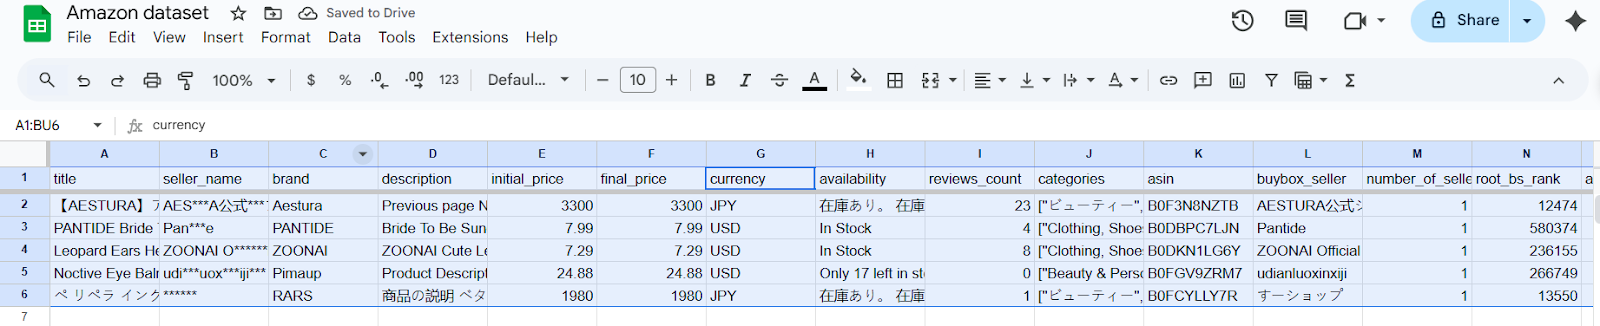
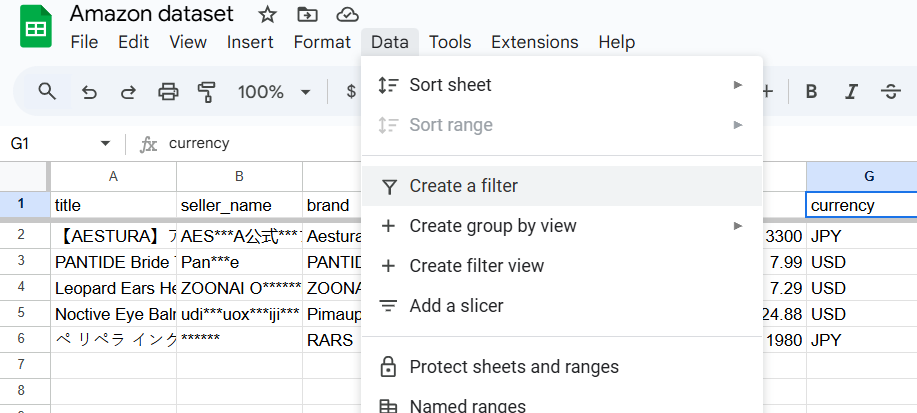
Manual data filtering walkthrough using Amazon marketplace data
Let me walk you through what most teams do when they need to filter data. We’ll use a real Amazon product dataset (courtesy of Bright Data datasets) to show you exactly how this plays out. This dataset includes various fields like product titles, brands, prices, ratings, and more from different categories and regions.
Faced with such a broad list, a data professional would need to isolate only the relevant products for a particular analysis to focus on useful information. To do so, they’d need to use the following steps:
- Start by filtering out any items that don’t meet your initial criteria of interest. In practice, this often means excluding products outside your target category or scope. For example, if we are only interested in beauty products, we would remove entries that belong to other categories.
- Using a tool like Google sheets or Excel, navigate to the Data tab and click on create a filter.

- A filter then appears in each column, and you can use it to customize the dataset as much as you want.
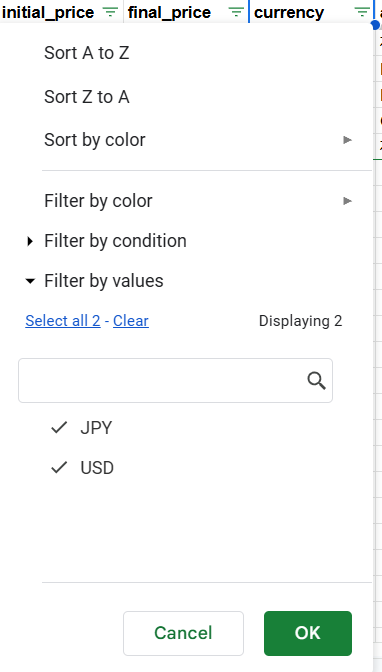
- For instance, if you want to filter out the products by currency, and only have products that have USD pricing, you’d go to the pricing column and apply that filter.

- Once you unmark the JPY, the dataset will show only products with USD pricing.
The first time you do this, it feels pretty good. You’re in control, you can see exactly what’s happening, and you catch interesting patterns as you go. “Oh look, eco-friendly products do seem to have higher ratings!”
But here’s what happens in practice:
- Week 1: This is great! I love having this control.
- Week 4: Okay, this is getting repetitive, but I’m still finding good insights.
- Week 12: I just spent my entire morning applying the same filters I used yesterday.
- Week 24: I think I forgot to clear the previous filter… are these numbers even right?
Many brilliant analysts burn out doing exactly this. Not because the work isn’t valuable, but because they’re spending 80% of their time on mechanical tasks instead of actual analysis.
Now that you know how to filter data manually, let’s look at the pros and cons of using this method.
Pros of Manual Filtering
- Manual filtering gives you Immediate visual feedback, allowing you to see results instantly and adjust filters iteratively. You can spot unexpected patterns or data quality issues as you work.
- You also get business context integration that enables nuanced decisions. When filtering ‘customers_say’ or ‘top_review’ fields, human judgment identifies sentiment and concerns that automated systems might miss.
- It enables flexible exploration that supports discovery-driven analysis. You might notice that products with ‘climate_pledge_friendly’ = TRUE have higher ratings, leading to new strategic insights.
- There’s a low barrier to entry which means any team member familiar with spreadsheets can perform analysis without technical training or specialized tools.
- You get to audit trail visibility through filter views, and documented criteria ensure analysis reproducibility and team collaboration.
Cons of Manual Filtering
- Scale limitations become apparent quickly. Filtering through more than 10,000 rows in Google Sheets causes noticeable performance degradation. With millions of Amazon products, you’re seeing only a tiny sample.
- Time intensity compounds with complexity. Applying the 8-step filtering process above takes 15-20 minutes for one analysis. Repeating this daily or across multiple categories becomes unsustainable.
- Human error probability increases with repetition. Accidentally selecting wrong operators (greater than vs. less than) or forgetting to clear previous filters leads to incorrect analysis.
- Inconsistency across users creates conflicting insights. Two analysts might interpret “high-quality seller” differently, filtering ‘seller_name’ or ‘rating’ with different thresholds.
- Limited reproducibility makes automation impossible. Each manual filtering session requires human intervention, preventing scheduled reports or real-time dashboards.
- Opportunity cost is significant. While analysts spend hours filtering data, competitors using automated solutions already act on insights. The time spent on mechanical filtering could be invested in strategic analysis and decision-making.
Overall, manual data filtering provides a high degree of control and clarity for the analyst, making it well-suited for exploratory analysis or small-scale data sets where understanding nuance is important. However, its inefficiency and error risks on large-scale data make it less suitable for big data or routine workflows.
In those cases, transitioning to automated filtering methods or tools is better, and we’re going to tell you exactly why.
Why Automated Data Filtering is Smarter, Faster & Scalable
When we about automated filtering, it’s not just about speed. Automation doesn’t just do what you were doing before faster, It does things you literally couldn’t do manually.
Remember that Amazon dataset with 73 different fields? Manually, you might explore 5-10 combinations of those fields. With automation, you can test thousands of combinations in parallel. You might discover that products with climate-friendly badges actually have 23% better customer retention but only in certain price ranges, and only when sold by specific types of sellers.
These aren’t insights you stumble upon. They’re insights that emerge when you can systematically explore every angle, and you can only find it through automated data filtering.
Automated filtering fundamentally changes what’s possible for an analyst or a company by processing millions of records in seconds, while applying hundreds of filter combinations simultaneously. It does this by codifying your criteria as machine-executable rules and running them at scale continuously.
Instead of clicking through columns, you can define declarative filters, push those filters as close to the source as possible, and get fast, reusable data. With automated data filtering, you can exhaustively explore thousands of field interactions in parallel, surfacing patterns that would never fit within a human’s limited exploration budget, and then reproduce them as much as you want.
| Dimension | Manual | Automated |
|---|---|---|
| Speed/Latency | Human-paced; minutes to hours per run | Machine-paced; seconds to minutes at scale |
| Scalability | Limited by UI and memory | Horizontal scaling (distributed compute, pushdown) |
| Reliability | Susceptible to human error | Deterministic, testable, idempotent |
| Freshness | Batch, ad hoc | Scheduled or streaming; near-real-time possible |
| Consistency | Varies by operator | Version-controlled logic; reproducible outputs |
| Cost | Hidden labor cost; rework | Compute-optimized; cache & predicate pushdown |
| Governance | Hard to audit | Lineage, logging, approvals, access controls |
One of the best tools you can use for automated data filtering is Brightdata’s Deep Lookup, which we’re going to talk about next.
Introducing Deep Lookup: Filter Data with Plain English
Deep Lookup is Bright Data’s AI-powered research tool that turns plain-English prompts into structured, accurate datasets. With Deep Lookup, you can ask for exactly what you need and get it back as a table you can use.
Instead of stitching sources together or writing complex queries, you describe the entities you want (companies, products, people, news, properties), the filters they must meet, and the columns you want to see. Deep Lookup handles the filtering, enrichment, and structuring behind the scenes to deliver analysis-ready results.
How Deep Lookup works
Deep Lookup encourages a two-line prompt format, like this:
- Find all… <entities and conditions>
- Show: <columns you want>
For example, a Deep Lookup example would look like this:
***Find all Amazon Beauty & Personal Care products priced ≤ $25 with rating ≥ 4 and in stock.***

***Show: product name, brand, current price, rating, number of reviews, product URL***
Deep Lookup takes that description and:
- Identifies the data sources it needs
- Applies your filters at the database level (not after downloading everything)
- Enriches the results with additional context
- Returns a clean, structured dataset you can immediately use
For more complex queries, you can use a more structured approach:
FIND ALL: [entity types]

FILTERS:

- Condition #1
- Condition #2

SHOW:

- Column #1 [Enrichment or Constraint]
- Column #2 [Enrichment or Constraint]
The key difference is that you’re describing business logic, not technical implementation. You don’t need to know which API endpoints to hit, how to handle pagination, or where to find competitor pricing data.
The datasets you get back from Deep Lookup are curated, structured, and delivered as Websets. Websets are verified and fully cited, customizable (choose the exact fields), and designed to stay up to date as Deep Lookup scans fresh sources.
In practice, the flow is:
- Ask your question
- Crawl & reason
- Get actionable results.
You can tailor Websets by entity, sector, geography, and data fields to match your use case.
Wrapping up
By now, you’ve seen that data filtering is how you turn messy, overwhelming information into clear decisions. Manual filtering builds intuition, but automation delivers speed, consistency, and the ability to surface patterns that no one can find one column at a time.
This is exactly where Bright Data helps. With Deep Lookup, you state your criteria in plain English and receive a clean, structured, always-fresh dataset you can plug into dashboards, notebooks, or models. Paired with Bright Data’s Datasets (like the Amazon dataset in this guide), you move from idea to insight to production without maintaining brittle pipelines.
Ready to see what automated filtering can do for your data? Try Deep Lookup with a free Bright Data account. Take those filtering rules you’ve been applying manually and see what insights you’ve been missing.

Technical Writer
Amitesh Anand is a developer advocate and technical writer sharing content on AI, software, and devtools, with 10k followers and 400k+ views.