A single HTTP error code can mask a dozen different proxy failures, forcing developers to waste hours correlating logs, checking configurations, and debugging the wrong layer of the network stack.
In this article we’ll learn about:
- The fundamental architecture of TLS decrypting forward proxies and the two separate connections they manage.
- The challenges developers face when debugging errors in these complex, multi-connection environments.
- How the RFC9209 Proxy-Status header standardizes error reporting across this proxy layer.
- A practical guide to implementing and parsing the Proxy-Status header, with examples from Bright Data’s 2026 update.
- Learn more about how different proxy servers fit into this architecture.
Let’s dive in!
How the Proxy Layer (TLS Interception) Works
In the architecture of a forward proxy like Burp Suite, the most critical and often misunderstood component is the Proxy Layer and its mechanism for handling encrypted traffic. This process, known as TLS Interception, is the engine that allows the proxy to inspect and modify HTTPS requests and responses that would otherwise be opaque.
Modern proxy servers such as Bright Data’s forward and reverse proxies follow this same architectural principle.
At its core, the proxy acts as a controlled “man-in-the-middle.” It doesn’t just relay packets; it establishes two, entirely independent TLS connections, effectively splitting the secure channel in two. The following diagram illustrates this fundamental separation:
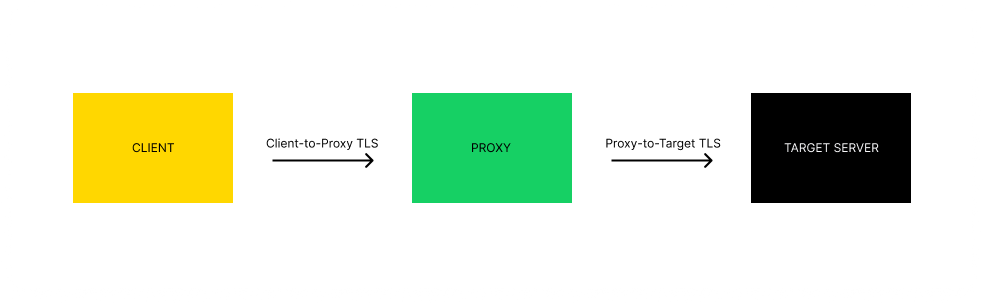
Let’s break down the two distinct TLS connections that form this chain
- The Client-to-Proxy Connection
This is where the magic of interception happens. When you configure your browser to use a tool like Burp Suite, the following sequence occurs:- The Client Hello: The client (your browser) sends a Client Hello message to the proxy. Crucially, this message contains the Server Name Indication (SNI) extension, which declares the intended destination hostname (e.g., brightdata.com).
- The Proxy’s Deception: The proxy, upon seeing the SNI, does not forward the Client Hello immediately. Instead, it dynamically generates a digital certificate on-the-fly for the requested hostname (brightdata.com).
- The Root of Trust: This generated certificate is not signed by a public Certificate Authority (CA) like Let’s Encrypt or DigiCert. It is signed by the proxy’s own local Certificate Authority (CA). For this to work, you must have pre-installed the proxy’s CA certificate (e.g., burp.crt) into your browser’s or operating system’s trust store. Because your machine trusts this CA, it automatically trusts all certificates the proxy generates.
- Handshake Completion: The proxy completes the TLS handshake with the client using this forged certificate. From the client’s perspective, it has successfully established a secure connection to brightdata.com. In reality, it has a secure connection only to the proxy.
- The Proxy-to-Target Connection
In parallel, the proxy handles the legitimate side of the connection:- New Connection: The proxy initiates a standard, legitimate TLS handshake with the real target server (brightdata.com).
- Validation: It receives and validates the server’s actual certificate against public trust stores, ensuring it is valid and issued by a trusted public CA.
- Secure Channel: This establishes a genuinely secure channel between the proxy and the target server.
The Inspection Chokepoint
With both secure channels established, the proxy becomes the intelligent middleman. It can now:
- Decrypt incoming traffic from the client using the private key from its forged certificate.
- Inspect, log, or modify the now-cleartext HTTP request.
- Re-encrypt the (potentially modified) request using the keys from its connection to the real server and forward it.
- Repeat the process in reverse for the server’s response.
This foundation is crucial for understanding where and how errors occur. Most TLS-related errors in tools like Burp Suite stem from a breakdown in the first connection—the client-to-proxy link. If the client does not trust the proxy’s CA, or if the proxy fails to generate a convincing certificate, the handshake fails, and interception becomes impossible. Understanding this two-connection model is the key to diagnosing and resolving these issues effectively.
How to Implement and Parse the Proxy-Status Header
Leverage RFC 9209 to transform your proxy debugging from guesswork into a precise science. This guide shows you how to implement the Proxy-Status header and parse its critical parameters to instantly pinpoint the stage and cause of request failures.
The Proxy-Status HTTP response header is a standardized way for proxies to report what happened during request processing. Instead of a cryptic 502 Bad Gateway, you now get a machine-readable reason for the failure.
Core Parameters for Pinpoint Diagnostics
When a request fails, parse these three key parameters in the Proxy-Status header:
| Parameter | Description | Example Value | What It Tells You |
|---|---|---|---|
error |
A predefined token describing the error type. This is your primary diagnostic. | http_request_error |
The category of failure. |
details |
A human-readable string with additional context. | "Invalid HTTP version" |
The specific reason for the error. |
received-status |
The HTTP status code the proxy received from the next hop (e.g., the origin server). | 503 |
Shows upstream server issues. |
Step-by-Step Implementation
Step 1: Configure Your Proxy to Emit the Header
First, ensure your proxy service (e.g., NGINX, Apache Traffic Server, a custom solution) is configured to add the Proxy-Status header to responses.
proxy_set_header Proxy-Status "error=<error_type>; details=\"<extra_info>\"; received-status=<status_code>";In practice, you would use variables to populate these values dynamically based on the error condition.
Step 2: Parse the Header in Your Client/Application
When your application receives an error response, check for the Proxy-Status header and parse its key-value pairs
import requests

def diagnose_proxy_failure(url, proxy_config):
    try:
        response = requests.get(url, proxies=proxy_config)
        # Force an exception for 4xx/5xx status codes to jump to the except block
        response.raise_for_status()
        return "Success", response

    except requests.exceptions.HTTPError as e:
        response = e.response

        # Check for the Proxy-Status header
        proxy_status_header = response.headers.get('Proxy-Status')
        diagnosis = "Unknown failure"

        if proxy_status_header:
            # Parse the parameters into a dictionary
            params = {}
            for part in proxy_status_header.split(';'):
                part = part.strip()
                if '=' in part:
                    key, value = part.split('=', 1)
                    params[key.strip()] = value.strip('"')

            # Diagnose based on the 'error' parameter
            error_type = params.get('error')
            details = params.get('details', 'No details provided.')

            if error_type == 'http_request_denied':
                diagnosis = f"CLIENT ISSUE: Request blocked by proxy policy. Details: {details}"
            elif error_type == 'dns_timeout':
                diagnosis = f"TARGET ISSUE: Proxy could not resolve the target domain. Details: {details}"
            elif error_type == 'destination_ip_unroutable':
                diagnosis = f"TARGET ISSUE: Proxy cannot route to the target IP. Details: {details}"
            elif error_type == 'connection_timeout':
                diagnosis = f"TARGET ISSUE: Proxy failed to connect to the target server. Details: {details}"
            elif error_type == 'http_response_incomplete':
                diagnosis = f"TARGET ISSUE: Origin server sent a malformed response. Details: {details}"
            else:
                diagnosis = f"PROXY ISSUE: {error_type}. Details: {details}"
        else:
            diagnosis = "Legacy proxy: No Proxy-Status header available. Fall back to generic HTTP status code analysis."

        return diagnosis, response
Bright Data’s Implementation
Bright Data uses a similar approach with its X-BRD-ERR-CODE header, which predates RFC 9209 but serves the same purpose. Let’s see how this maps to the new standard.
Scenario: You try to access an IPv4-only website using an IPv6 proxy.
- What you see: An HTTP 502 Bad Gateway error.
- Without Proxy-Status: You have to check logs or documentation to guess if it’s a client, proxy, or target error.
- With Bright Data’s Headers:
HTTP/1.1 502 Bad Gateway X-BRD-ERR-CODE: target_40011Their documentation states that target_40011 means “Target host has no IPv6 address.” - With RFC 9209 Standard:
HTTP/1.1 502 Bad Gateway Proxy-Status: destination_ip_unroutable; details="Target host has no IPv6 address"; received-status=502
Now, any RFC 9209-compliant client can automatically understand and handle this error without vendor-specific logic.
Troubleshooting Flowchart with Proxy-Status
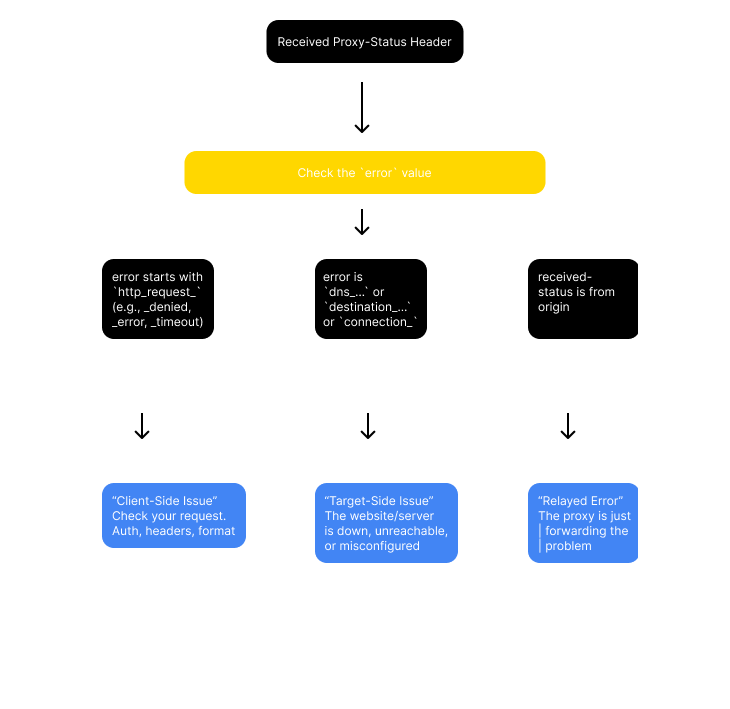
By implementing and parsing the Proxy-Status header, you move from generic error codes to precise, actionable diagnostics, drastically reducing the time needed to resolve proxy-related issues.
Key Challenges in Modern Proxy Troubleshooting
Before the standardization efforts like RFC 9209, debugging proxy-related issues was often a frustrating exercise in deciphering cryptic clues. The core of the problem lay in the fundamental mismatch of context between the two independent TLS connections described in the previous section. When an error occurred, the proxy had to represent a complex, two-stage failure with a single, often vague, HTTP status code.
These issues often affect all types of proxy servers, from simple HTTP relays to complex TLS-intercepting gateways.
The classic example is the 502 Bad Gateway error. From an end-user’s perspective, this is a single, unhelpful message. However, for the network administrator, this single code could mask at least three distinct points of failure, each in a different part of the transaction:
DNS Failure on the Proxy-to-Target Connection
The proxy itself could not resolve the target server’s hostname. The client’s connection to the proxy was fine, but the proxy’s onward journey failed at the very first step.
TLS Handshake Failure on the Proxy-to-Target Connection
The proxy reached the target server, but they could not negotiate a secure connection. This could be due to the server requiring an outdated cipher suite, presenting an expired certificate, or having a hostname mismatch.
Authentication or Policy Block on the Client-to-Proxy Connection
The client successfully connected to the proxy, but the request was denied by the proxy’s own internal policy. This could be due to lacking credentials, attempting to access a blacklisted URL category, or triggering a data loss prevention (DLP) rule.
The critical challenge was that the HTTP protocol, at the time, provided no standard mechanism to convey which of these failures occurred or why. The proxy was forced to collapse a multi-layered network error into a single, generic status code.
The Vendor-Specific Workaround
In the absence of a standard, proxy vendors developed their own proprietary solutions to provide more detail. They began adding custom HTTP headers to the error responses sent back to the client.
For example, a troubleshooting guide for “Vendor X” might instruct you to look for a header like:
X-Proxy-Error: POLICY_BLOCK_URL_CATEGORY_GAMBLING
While a guide for “Vendor Y” might use:
X-CorpFirewall-Reason: AUTH_FAILURE_CLIENT_CERT
This approach created several new problems:
- Vendor Lock-in: Troubleshooting procedures became entirely specific to the security vendor’s product. An administrator’s knowledge was not transferable.
- Client-Side Opacity: These custom headers were often stripped out by intermediate systems, ignored by client applications, or not logged in standard web server access logs.
- Lack of Consistency: There was no common dictionary of error types, making it difficult to build unified monitoring and alerting systems in environments with multiple proxy types.
This landscape of opaque errors and non-standard headers made systematic debugging slow and inefficient. It created a clear need for a universal, vendor-agnostic method to communicate the “why” behind a proxy’s rejection of a request, paving the way for a formal standard.
What is the RFC9209 Proxy-Status Header?
The IETF standard that replaces guesswork with precision in proxy troubleshooting.
Before RFC9209: A single 502 Bad Gateway could mean anything – DNS failure, policy block, or target timeout. No standard way to tell the difference.
After RFC9209: Every proxy in the chain can report exactly which connection failed and why, using structured parameters like:
- error: Predefined failure type (e.g., dns_timeout, http_request_denied)
- details: Human-readable explanation
- received-status: HTTP status from upstream
Result: Instant clarity between client-side vs. target-side failures, vendor-agnostic.
Bright Data’s Adoption of RFC9209: A 2026 Update
Transitioning from proprietary headers to universal standards. Bright Data is now replacing its custom x-brd-err-code headers with the RFC9209 Proxy-Status header.
Current State (2026):
- Dual-support period: Both
x-brd-err-codeandProxy-Statusheaders are returned - Example:
target_40011errors now also includeProxy-Status: destination_ip_unroutable
Future Plan:
- Gradual deprecation of
x-brd-*headers - Full migration to the universal
Proxy-Statusstandard - Documentation updates to reflect new troubleshooting approach
Impact: Customers can now use standardized tooling across all proxy providers.
A Guide to Common Proxy Errors Using RFC9209
This section maps common HTTP proxy errors to the new standard, clearly distinguishing which part of the proxy chain is responsible.
The reliability of your proxy network, such as a residential proxy network, directly affects how and where these errors appear in production environments.
- HTTP 407 & Client Error Codes: Client to Proxy Issues (e.g.,
client_10000: Authentication failed at the proxy gateway). - HTTP 403 & Policy Error Codes: Proxy Policy Blocks (e.g.,
policy_20050: Request blocked by compliance rules before reaching the target). - HTTP 429: Rate Limiting and Throttling
- HTTP 502 & Target Error Codes: Proxy to Target Issues (e.g.,
target_40001: DNS failure when the proxy tried to connect to the target server).
Tools and Best Practices for Proxy Debugging with RFC9209
Essential tools:
curl -vto inspectProxy-Statusheader directly- Browser Developer Tools (Network tab)
- Custom scripts parsing the structured
errorcodes
Best practices:
- Build automated monitoring that alerts on specific
Proxy-Statuserror types - Use the details field for immediate diagnosis and resolution
- Create dashboards tracking error categories (client vs. target issues)
Implement retry logic based on error types (e.g., retry dns_timeout, don’t retry http_request_denied)
For teams requiring dedicated IP configurations, you can explore Bright Data’s exclusive and private IP options to ensure consistent network behavior during testing and debugging.
Conclusion
RFC9209 transforms proxy debugging from guesswork into precise, actionable diagnostics. By standardizing Proxy-Status headers, it replaces generic errors like “502 Bad Gateway” with structured, machine-readable information, reducing troubleshooting time and enabling smarter automation across your proxy ecosystem.
If you are tired of debugging cryptic proxy errors, Bright Data’s proxy services provide robust infrastructure that, combined with standards like RFC9209, reduces errors and streamlines data collection.
Learn more:

Technical Writer
Arindam Majumder is a developer advocate, YouTuber, and technical writer who simplifies LLMs, agent workflows, and AI content for 5,000+ followers.