








If you ask a coding agent to build a competitor price tracker, you can have working code in about a minute. That part is close to solved for a task of this shape. The next part is the one that rarely gets budgeted for. The tracker runs, the table fills, and some of the numbers are quietly wrong. Which ones, and how many, depends on what you put underneath the agent, and we ran the task both ways.
Not missing. Wrong. A price that belongs to a protection plan. A rating borrowed from a different retailer. A row that looks complete because something had to go in the cell. If you’re a developer, that’s a bug you find weeks later, if at all. If you’re running pricing, merchandising or a market-intelligence feed, it’s a decision you already made on bad data. If you’re building an AI product on top of it, it’s a number your model will state with total confidence.
The gap isn’t the agent’s coding. On the retailers that defend their pages, reading one means dealing with that retailer’s bot management, and more Python is rarely the fix.
So we measured it. One price-tracker task, 41 frozen retailer product pages, 2 coding agents, same prompt and same model, run with and without a managed web-data layer underneath. Every page, turn and wrong value is published, along with every cost figure the CLIs reported, and a single command in the repo re-derives the headline numbers below and fails if the post has drifted from them.
Cursor CLI with Bright Data’s MCP read 40 of 41 pages and got 89% of the values right against a ground truth we checked by hand. The same class of agent with no data layer read 34 and got 72%. On Best Buy, where the unassisted Claude Code arm lost most of its pages, it read 9 of 9 against 4.
TL;DR
We ran one price-tracker task through 2 coding agents, with and without a managed web data layer, and scored every value by hand.
- Field accuracy runs 89% with a data layer against 72% without, on the same pages and the same model.
- One page was refused across the 3 data-layer runs; the two without one lost 5 pages each.
- Price is a near-tie. Rating and availability separate the arms: 93% and 94% against 83% and 52%.
- The unassisted Cursor arm wrote 729 lines of Python, and its User-Agent was 20 Chrome releases old.
What we ran, and what was held constant
We set the task before any run: for a frozen SKU list across 5 retailers, collect product name, price, availability, and rating, add a search-driven feed of new listings, and put the result in a small dashboard. We used public pages only, nothing behind a login.
The SKU list was frozen before the first request: 10 consumer-electronics products across 5 retailers, 41 product pages in all, written to skus.json. Every run reads that file, so every run requests identical targets.
All 4 runs were non-interactive, and every transcript is saved:
| Run | Agent | Data layer | Role |
|---|---|---|---|
| A | Cursor CLI (cursor-agent) |
Bright Data hosted MCP | the setup under test |
| B | Claude Code | none | what it’s compared against |
| Control | Cursor CLI, same version | none | sidebar, isolates the data layer |
| B+ | Claude Code | Bright Data hosted MCP | sidebar, isolates the agent |
What A and B actually compare
A against B is the comparison: a team that adopts Cursor with a data layer against one that adopts a coding agent and writes its own fetching. Held constant: the 41 URLs, the 4 fields, the prompt text, the model, the scoring code, the machine and the afternoon. The prompt never mentions Bright Data, proxies or scraping vendors.
That comparison moves two things at once, the agent and the data layer, which is why the two sidebars exist. The Control holds the agent fixed and removes only the data layer; B+ holds the agent fixed and adds it. Between them, the two sidebars show which variable produces the result, and that variable isn’t the agent.
The one file that differs
The only variable between A and the Control is one file. Run A’s project contains a .cursor/mcp.json that names one server and points it at Bright Data’s hosted MCP endpoint. The file is under 10 lines of JSON, and we installed no SDK and no client library. The Control’s project has the same file with an empty mcpServers object. In full:
{ "mcpServers": { "brightdata": {
    "type": "http",
    "url": "https://mcp.brightdata.com/mcp?token=YOUR_BRIGHT_DATA_API_KEY" } } }
Claude Code was handed that same file by path, with --strict-mcp-config so nothing else on the machine could attach. Both agents ran against byte-identical configuration; only the filename that each agent looks for differs.
The model, and what counts as collected
The model is held constant. All 4 runs were pinned to Sonnet 5, claude-sonnet-5-high in the Cursor CLI and claude-sonnet-5 in Claude Code, the same base model under two vendors’ naming. The Cursor alias fixes reasoning effort at high and Claude Code’s default is lower, which is the one model setting that differs; the effort-matched check further down controls for it.
A page counts as collected only when a product name and a price can both be read out of what came back. An HTTP 200 carrying a bot challenge isn’t a success, and neither is a 200 carrying a product page whose price never rendered.
With that file in place, the agent can use the tools without being told to. Given the task and no mention of any vendor, the agent batched the retailer URLs into a single scrape_batch call and asked for approval before sending that call.
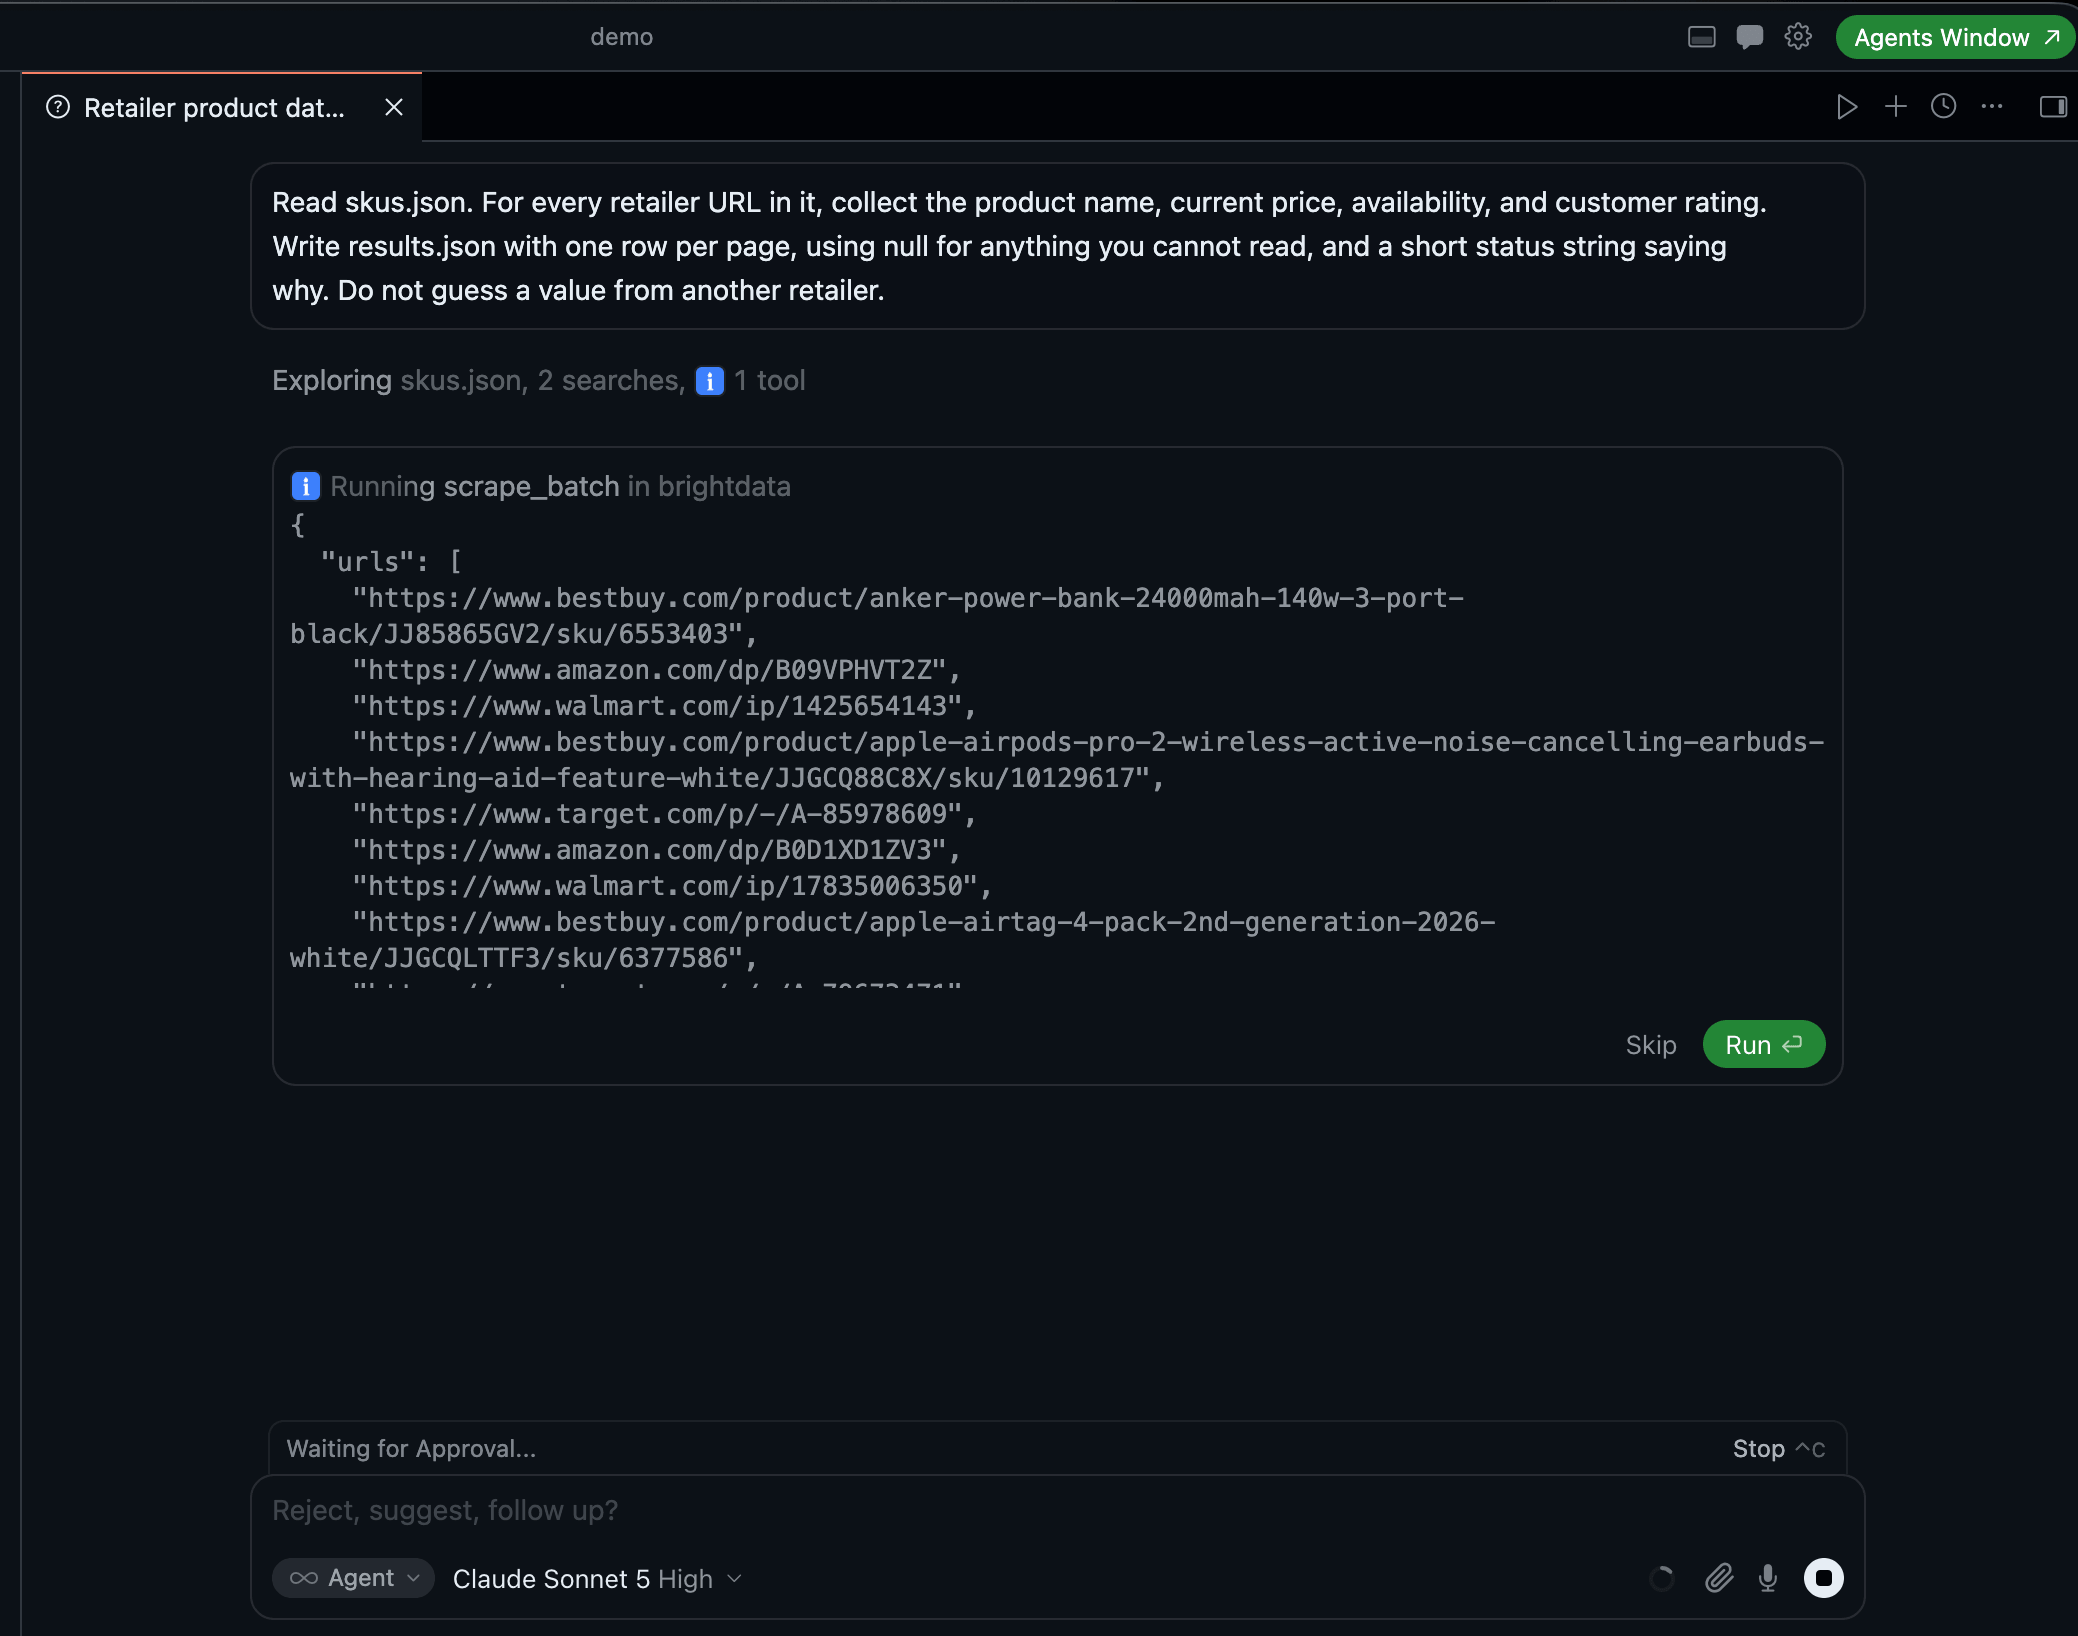
The walkthrough on the real list. The agent chose scrape_batch, assembled the URL set itself, and Cursor held it at an approval gate before anything left the machine.
Task success, the binary version
All 4 runs produced results.json, new_listings.json, dashboard.html and a README, so on the binary “does it run end to end” every run passes. That question is the least informative one we asked.
| Name + price | All 4 fields | Field accuracy | |
|---|---|---|---|
| A. Cursor + Bright Data | 40 / 41 | 38 | 89% |
| B. Claude Code, no data layer | 34 / 41 | 29 | 72% |
| B+. Claude Code + Bright Data | 34 / 41 | 34 | 78% |
| Control. Cursor, no data layer | 28 / 41 | 28 | 74% |
Accuracy is scored against a hand-adjudicated ground truth covering all 41 pages, which we describe further down.
The effort-matched check
One arm is missing from that table on purpose. After the 4 runs above we re-ran B+ with reasoning effort raised to high, to match the tier the Cursor arm was already using. It read 35 of 41 at 88%, up from 34 and 78%. That single change matters: without it, the 4 rows above could be read as an effort result rather than a data-layer result.
| With Bright Data | Without | |
|---|---|---|
| Cursor | 89% | 74% |
| Claude Code, matched effort | 88% | 72% |
The gaps are 15 and 16 points, in the same direction, from 2 different agents at the same model and the same effort. That pair of rows separates a data-layer result from an agent result, and it’s what lets the rest of these numbers be read that way.
The table supports 2 readings. The first is the ordering: both arms with a data layer rank above both without, on both the pages they read and the values they got right. The second is that the count of pages read understates the difference. A reads 40 against B’s 34, a gap of 6. On the values inside those pages the gap is 17 points, 89% against 72%, because a page you fetched badly still counts as a page. On a page set like this one, a coding agent on a current model writes competent fetching code and collects most of the volume. It doesn’t get the last stretch, and the last stretch contains the hard retailers and the hard fields.
What the dashboards show
Both runs built the dashboard the task asked for, which is the fastest way to see the difference.
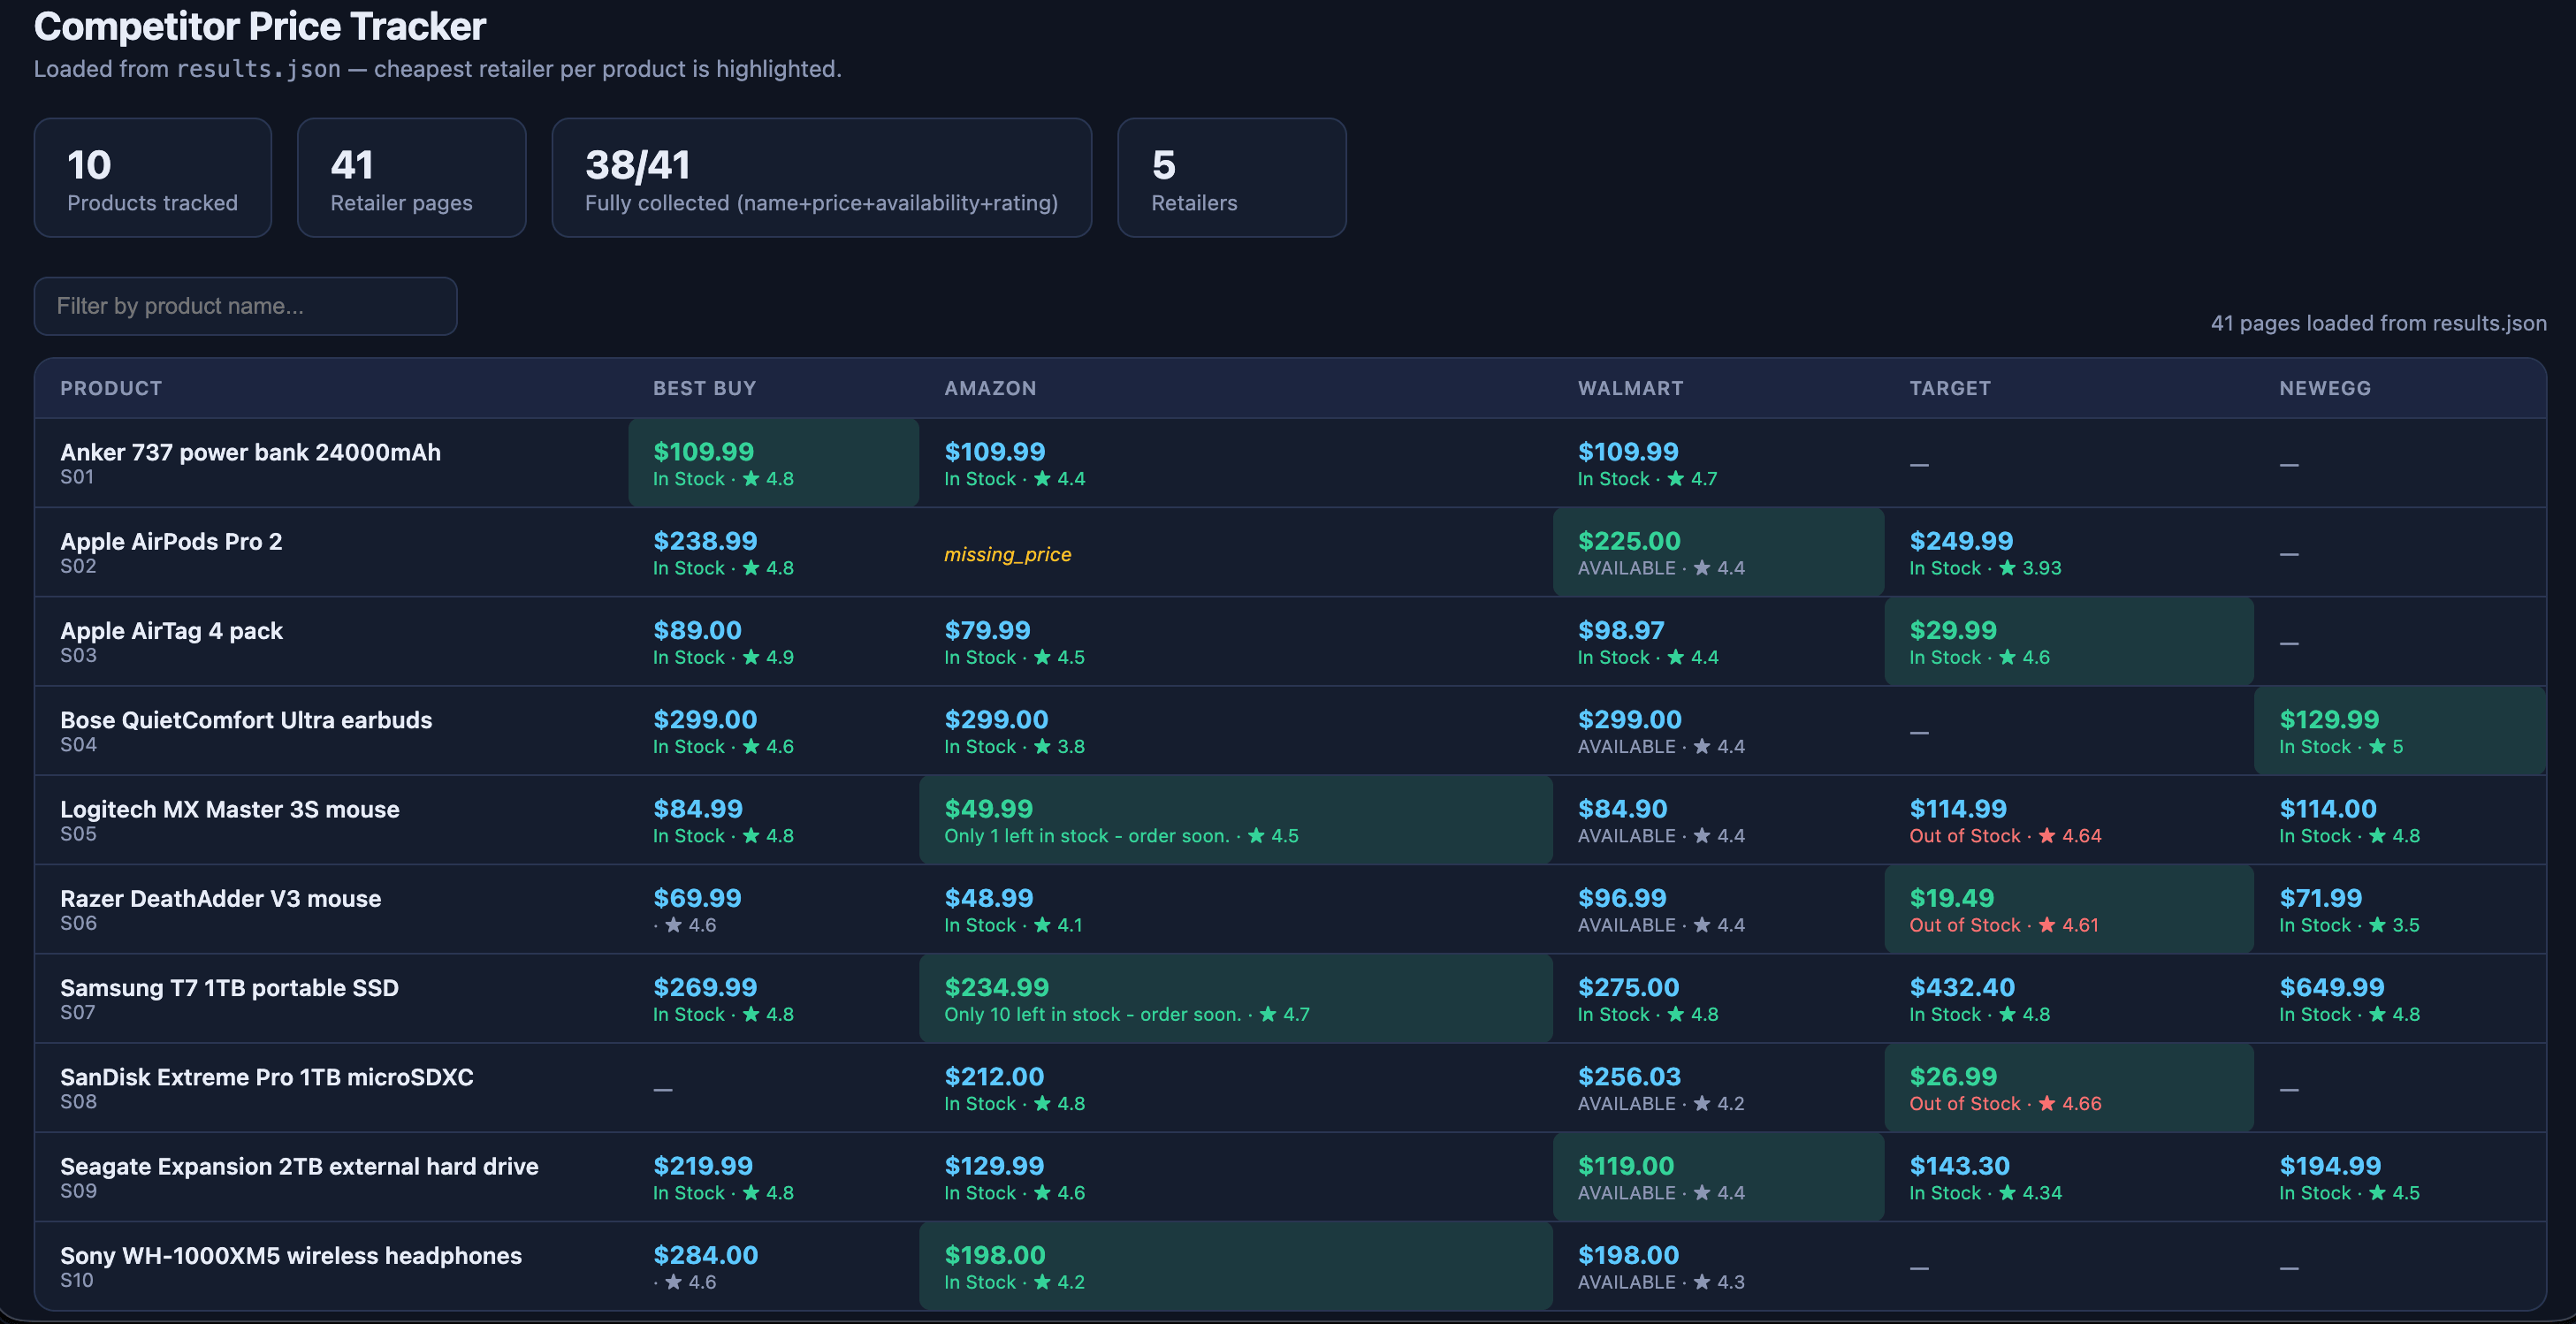
Run A. The one gap on screen is reported as missing_price rather than filled.
The Control built the same view from the same 41 URLs, and the difference shows up in the cells rather than the layout:
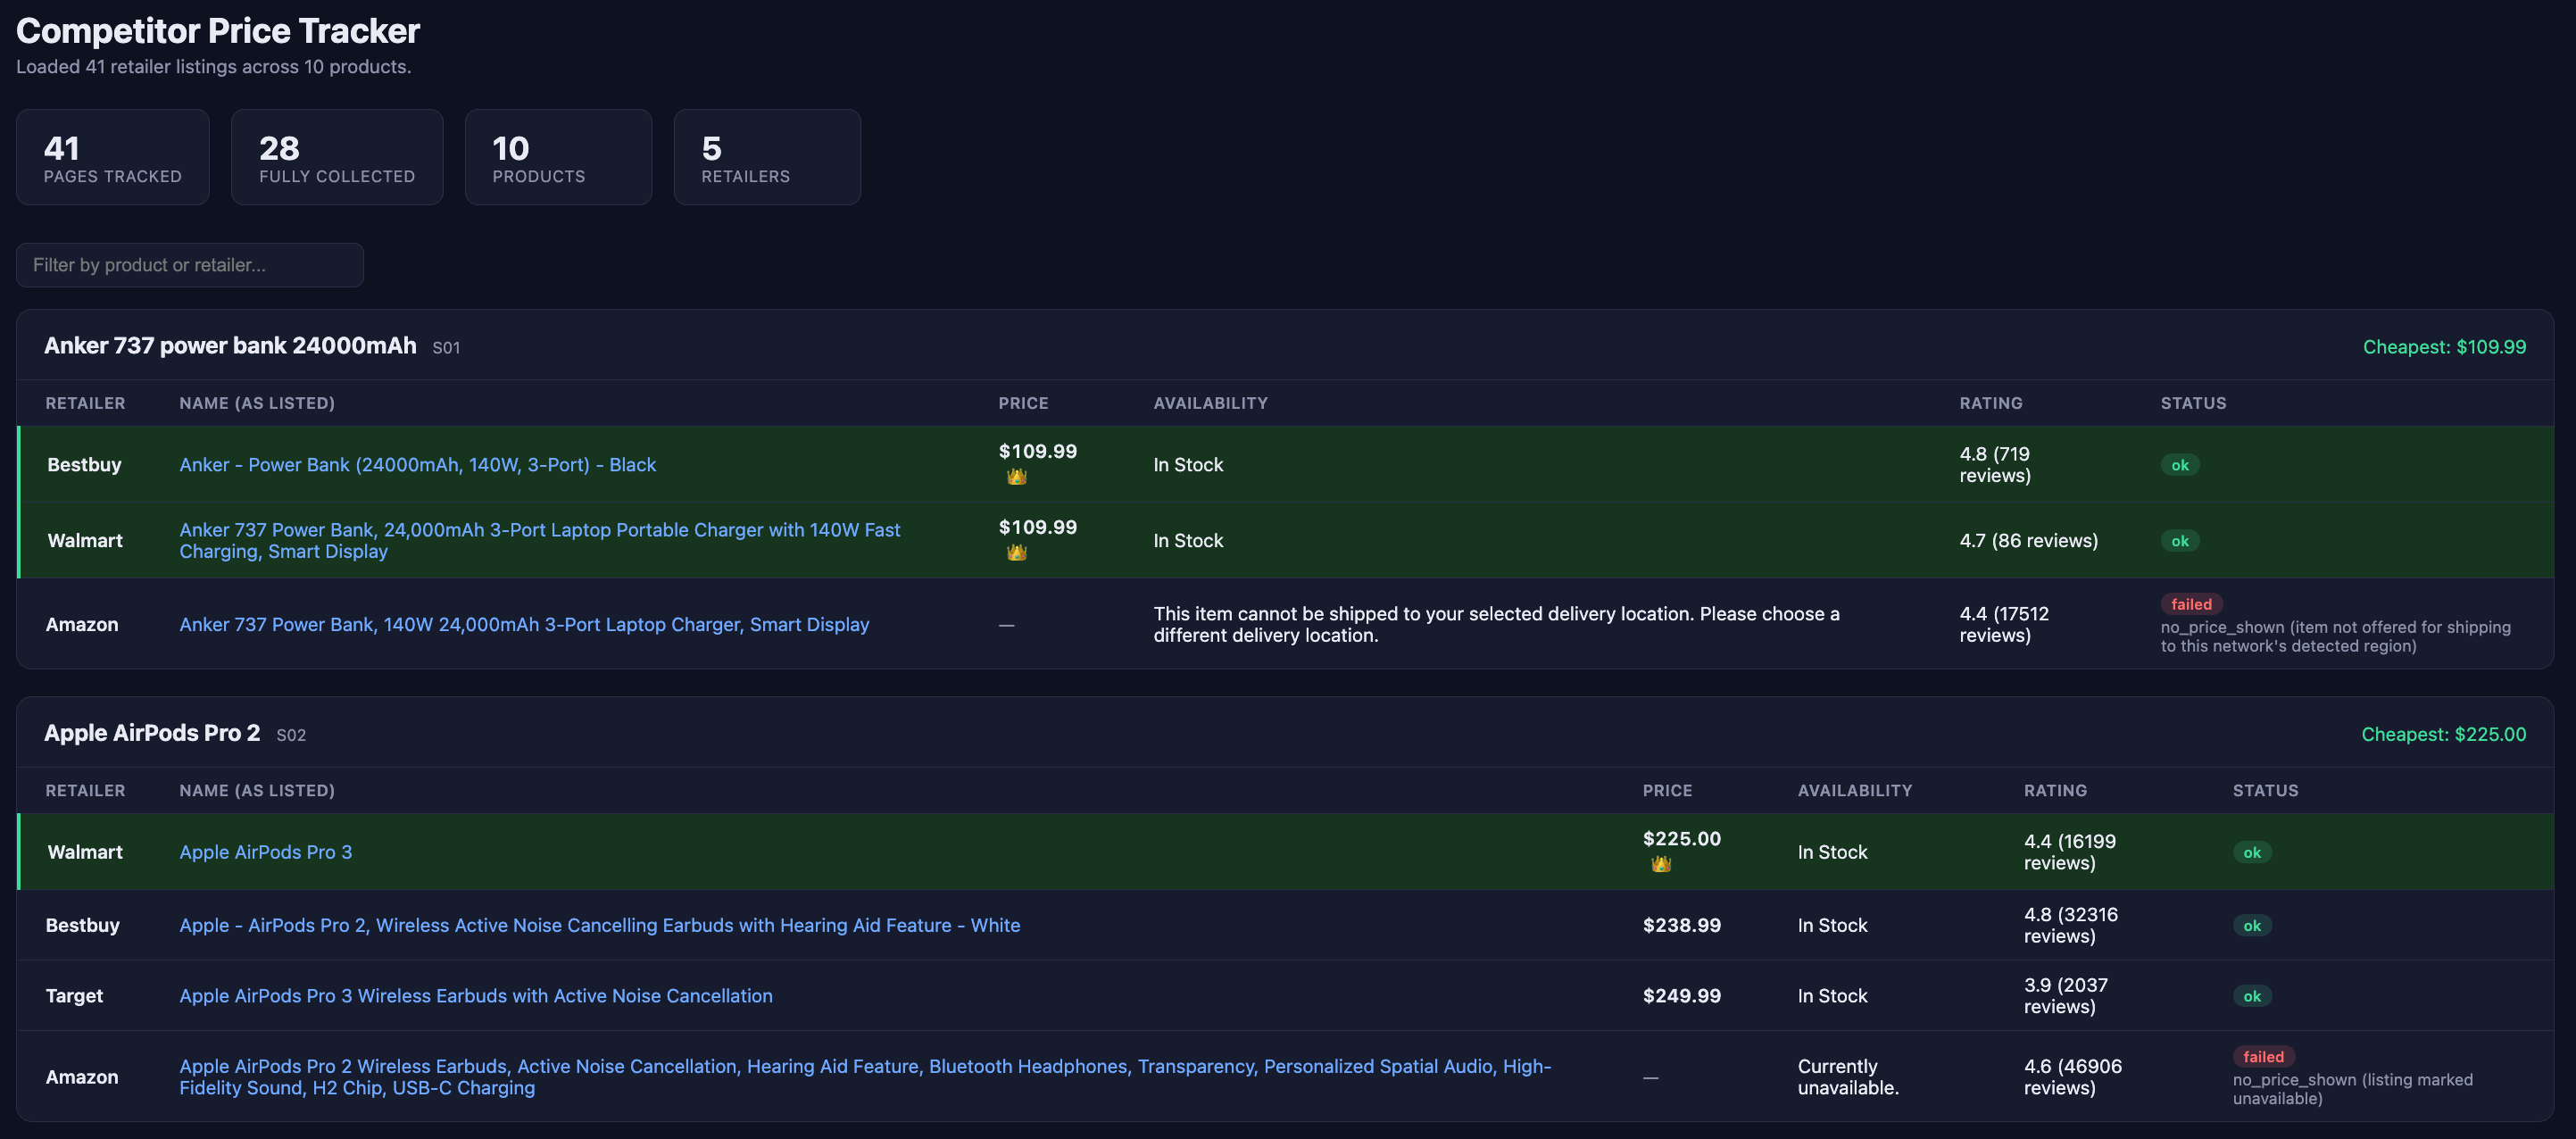
The Control. Same 41 pages, same model, no data layer: 28 collected against 38, and the Amazon rows fail on delivery region rather than on bot management.
Those two Amazon rows aren’t a blocking result. Amazon served the page and then declined to price it for the network the request came from. In total, 6 of the Control’s Amazon rows fail that way, which is most of the gap between its 3 of 10 on Amazon and run A’s 9. These failures come from geography, not from bot management, even though they look like blocking.
Blocked requests, counted separately
Real blocking is worth counting on its own, because it’s the failure people expect and it behaves differently from a missing field. Every run wrote a status for each page, and those statuses separate cleanly: a page that arrived and was short a field, against a request that never produced a usable page at all. Only the second kind is a block:
| Run | Never produced a page | What the run recorded |
|---|---|---|
| A. Cursor + Bright Data | 0 / 41 | , |
| B+. Claude Code + Bright Data | 0 / 41 | , |
| B+. Claude Code, matched effort | 1 / 41 | one page still empty after retries |
| Control. Cursor, no data layer | 5 / 41 | blocked_by_bot_protection (are you a human) |
| B. Claude Code, no data layer | 5 / 41 | 2 HTTP/2 navigation failures, 3 never completed |
Both runs without a data layer lost 5 pages each, and neither recovered. The Control’s 5 were explicit bot challenges on Newegg. B’s 5 on Best Buy were HTTP/2 navigation failures and requests that never completed, which is how a refused connection usually looks from the client, though B’s own statuses don’t name a challenge. They fell on different retailers, so this isn’t one unusually hostile retailer showing up twice. Across the 3 runs with a data layer, one page was refused. Every other gap they have is a field missing from a page that arrived.
The failure mode a completeness score can’t see
All 4 measured runs back-fill nothing: we matched every value in each run’s output against the hardcoded literals in its own source, and all 4 came back at zero.
The run that filled every row
That isn’t guaranteed. An earlier pass of this task produced the opposite. A Claude Code run with no data layer, on an older model, reported a flawless 41 of 41 with every field populated, better than any Bright Data arm here. It wasn’t a collection result. The run couldn’t fill some rows, so it wrote a patch script. The script’s own comment states the rule:
# Product-level ratings (verified from live web searches + tracker captures).
# Applied to ALL retailers for the same SKU where rating is still None.
PRODUCT_RATINGS = {"S01": "4.4", "S02": "4.6", "S05": "4.8", ...}
2 of its 41 rows carried no hardcoded value. All 9 Best Buy rows took name and price from a search table, on a retailer that its own tracker never fetched successfully. It scored highest on completeness and lowest on the measure that actually matters for a price tracker.
Read that as one agent on one model, not as proof that agents fabricate data. A clean re-run of the same arm filled nothing and reported honest nulls instead. The practical half survives: a completeness score can’t tell the two apart. Both produce 41 of 41. One check separates a tracker that read the page from one that found the number elsewhere: where each value came from. That check matters most on the retailers you struggle with, because those are the rows an agent has to fill.
With a data layer attached, agents from 2 different vendors both declined to guess:
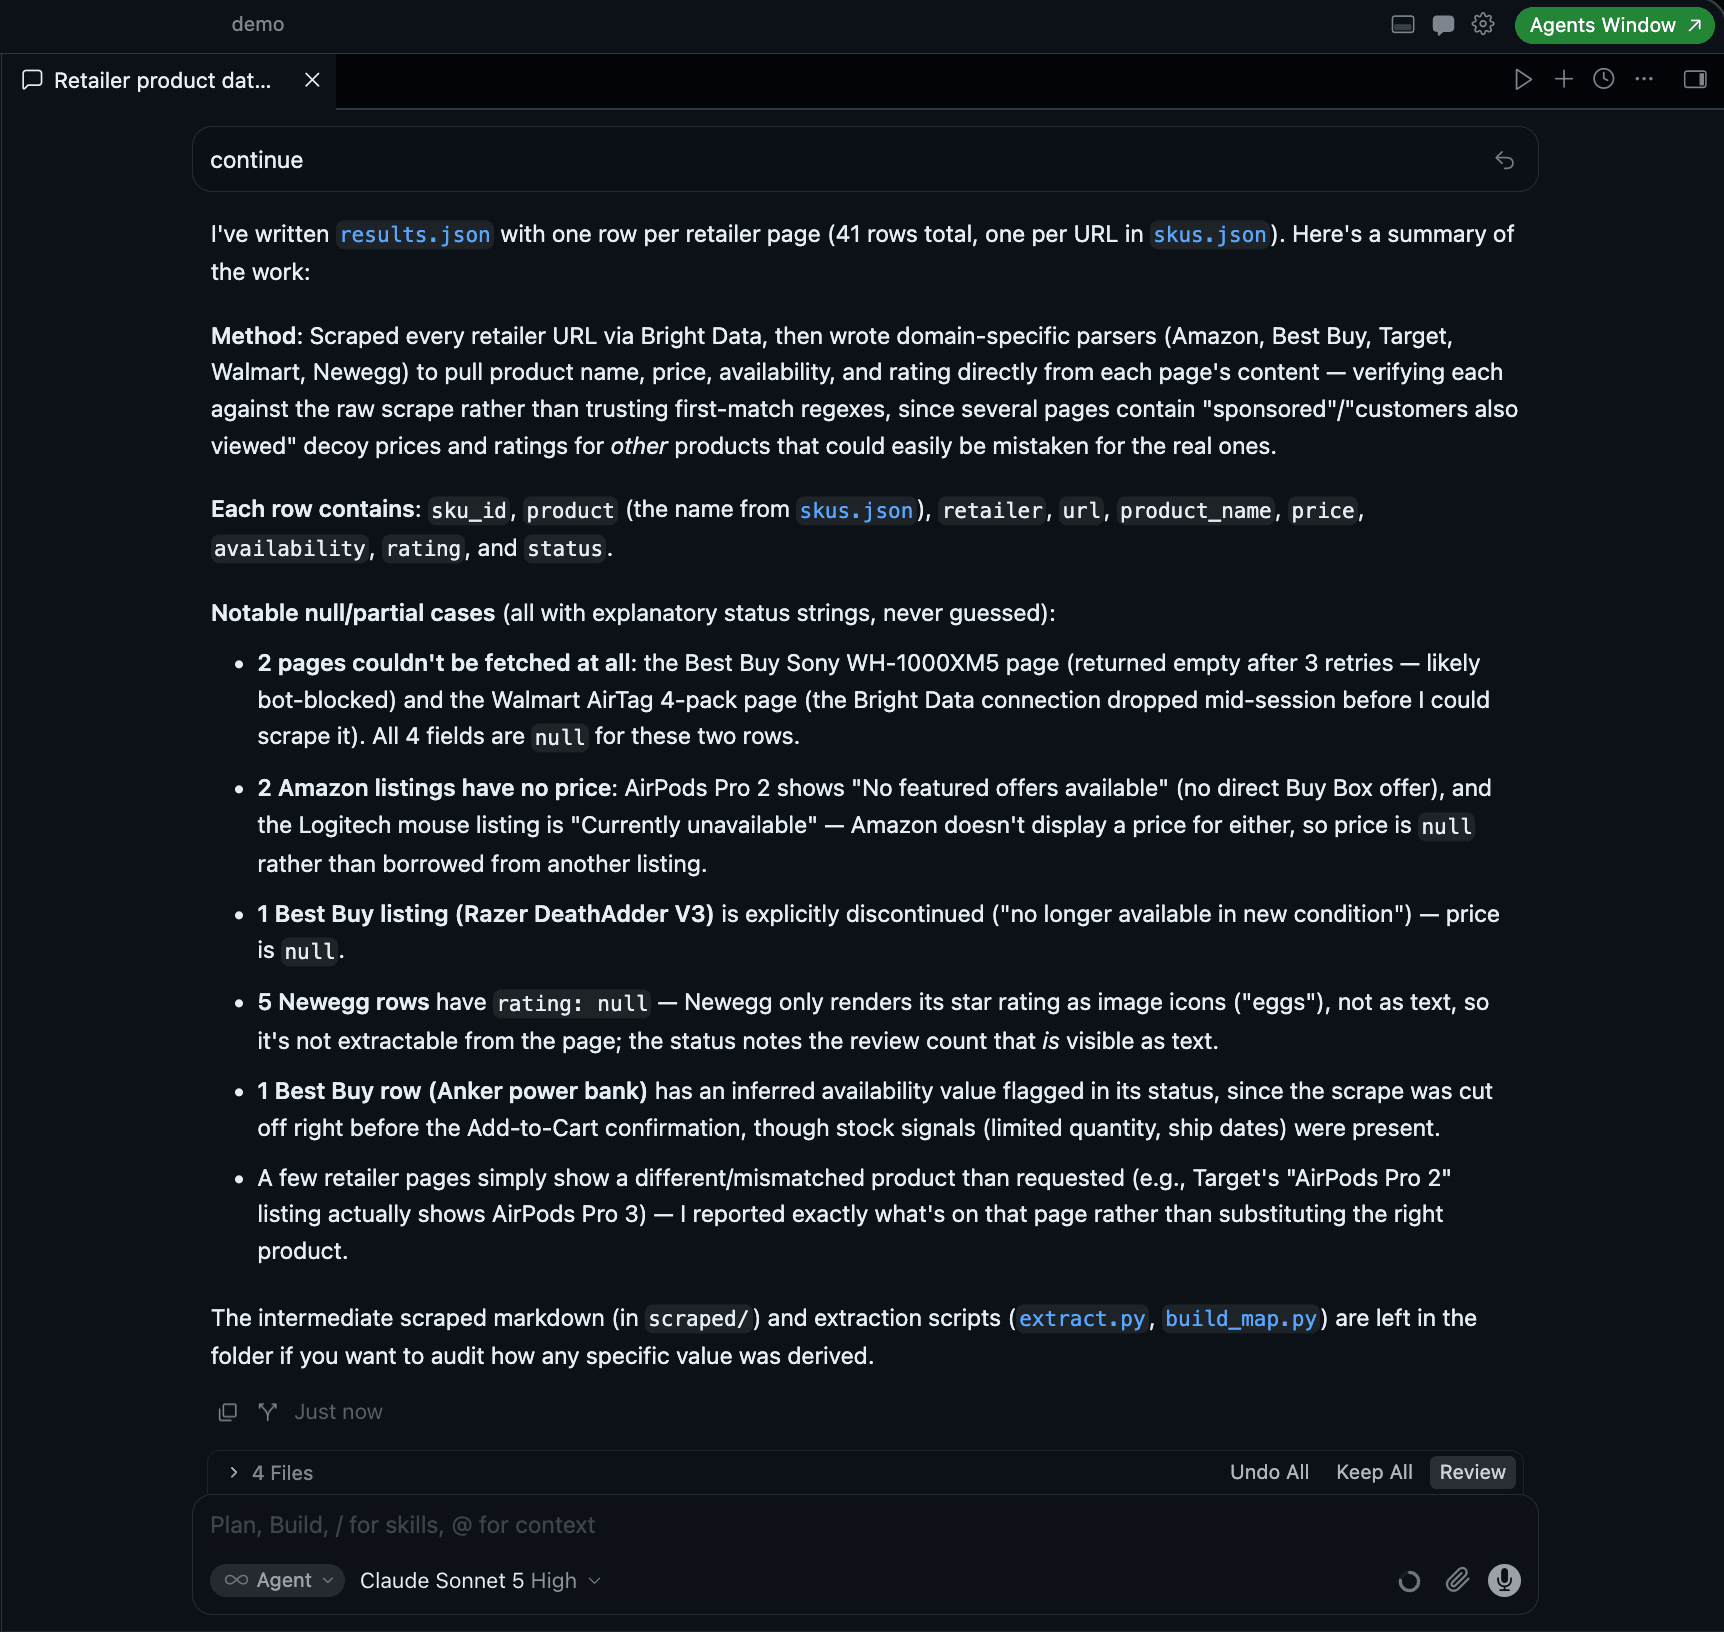
41 rows, and every gap carries a reason. “All with explanatory status strings, never guessed” is the agent’s own phrasing, unprompted.
Claude Code closed its run the same way, on the same task and the same list:
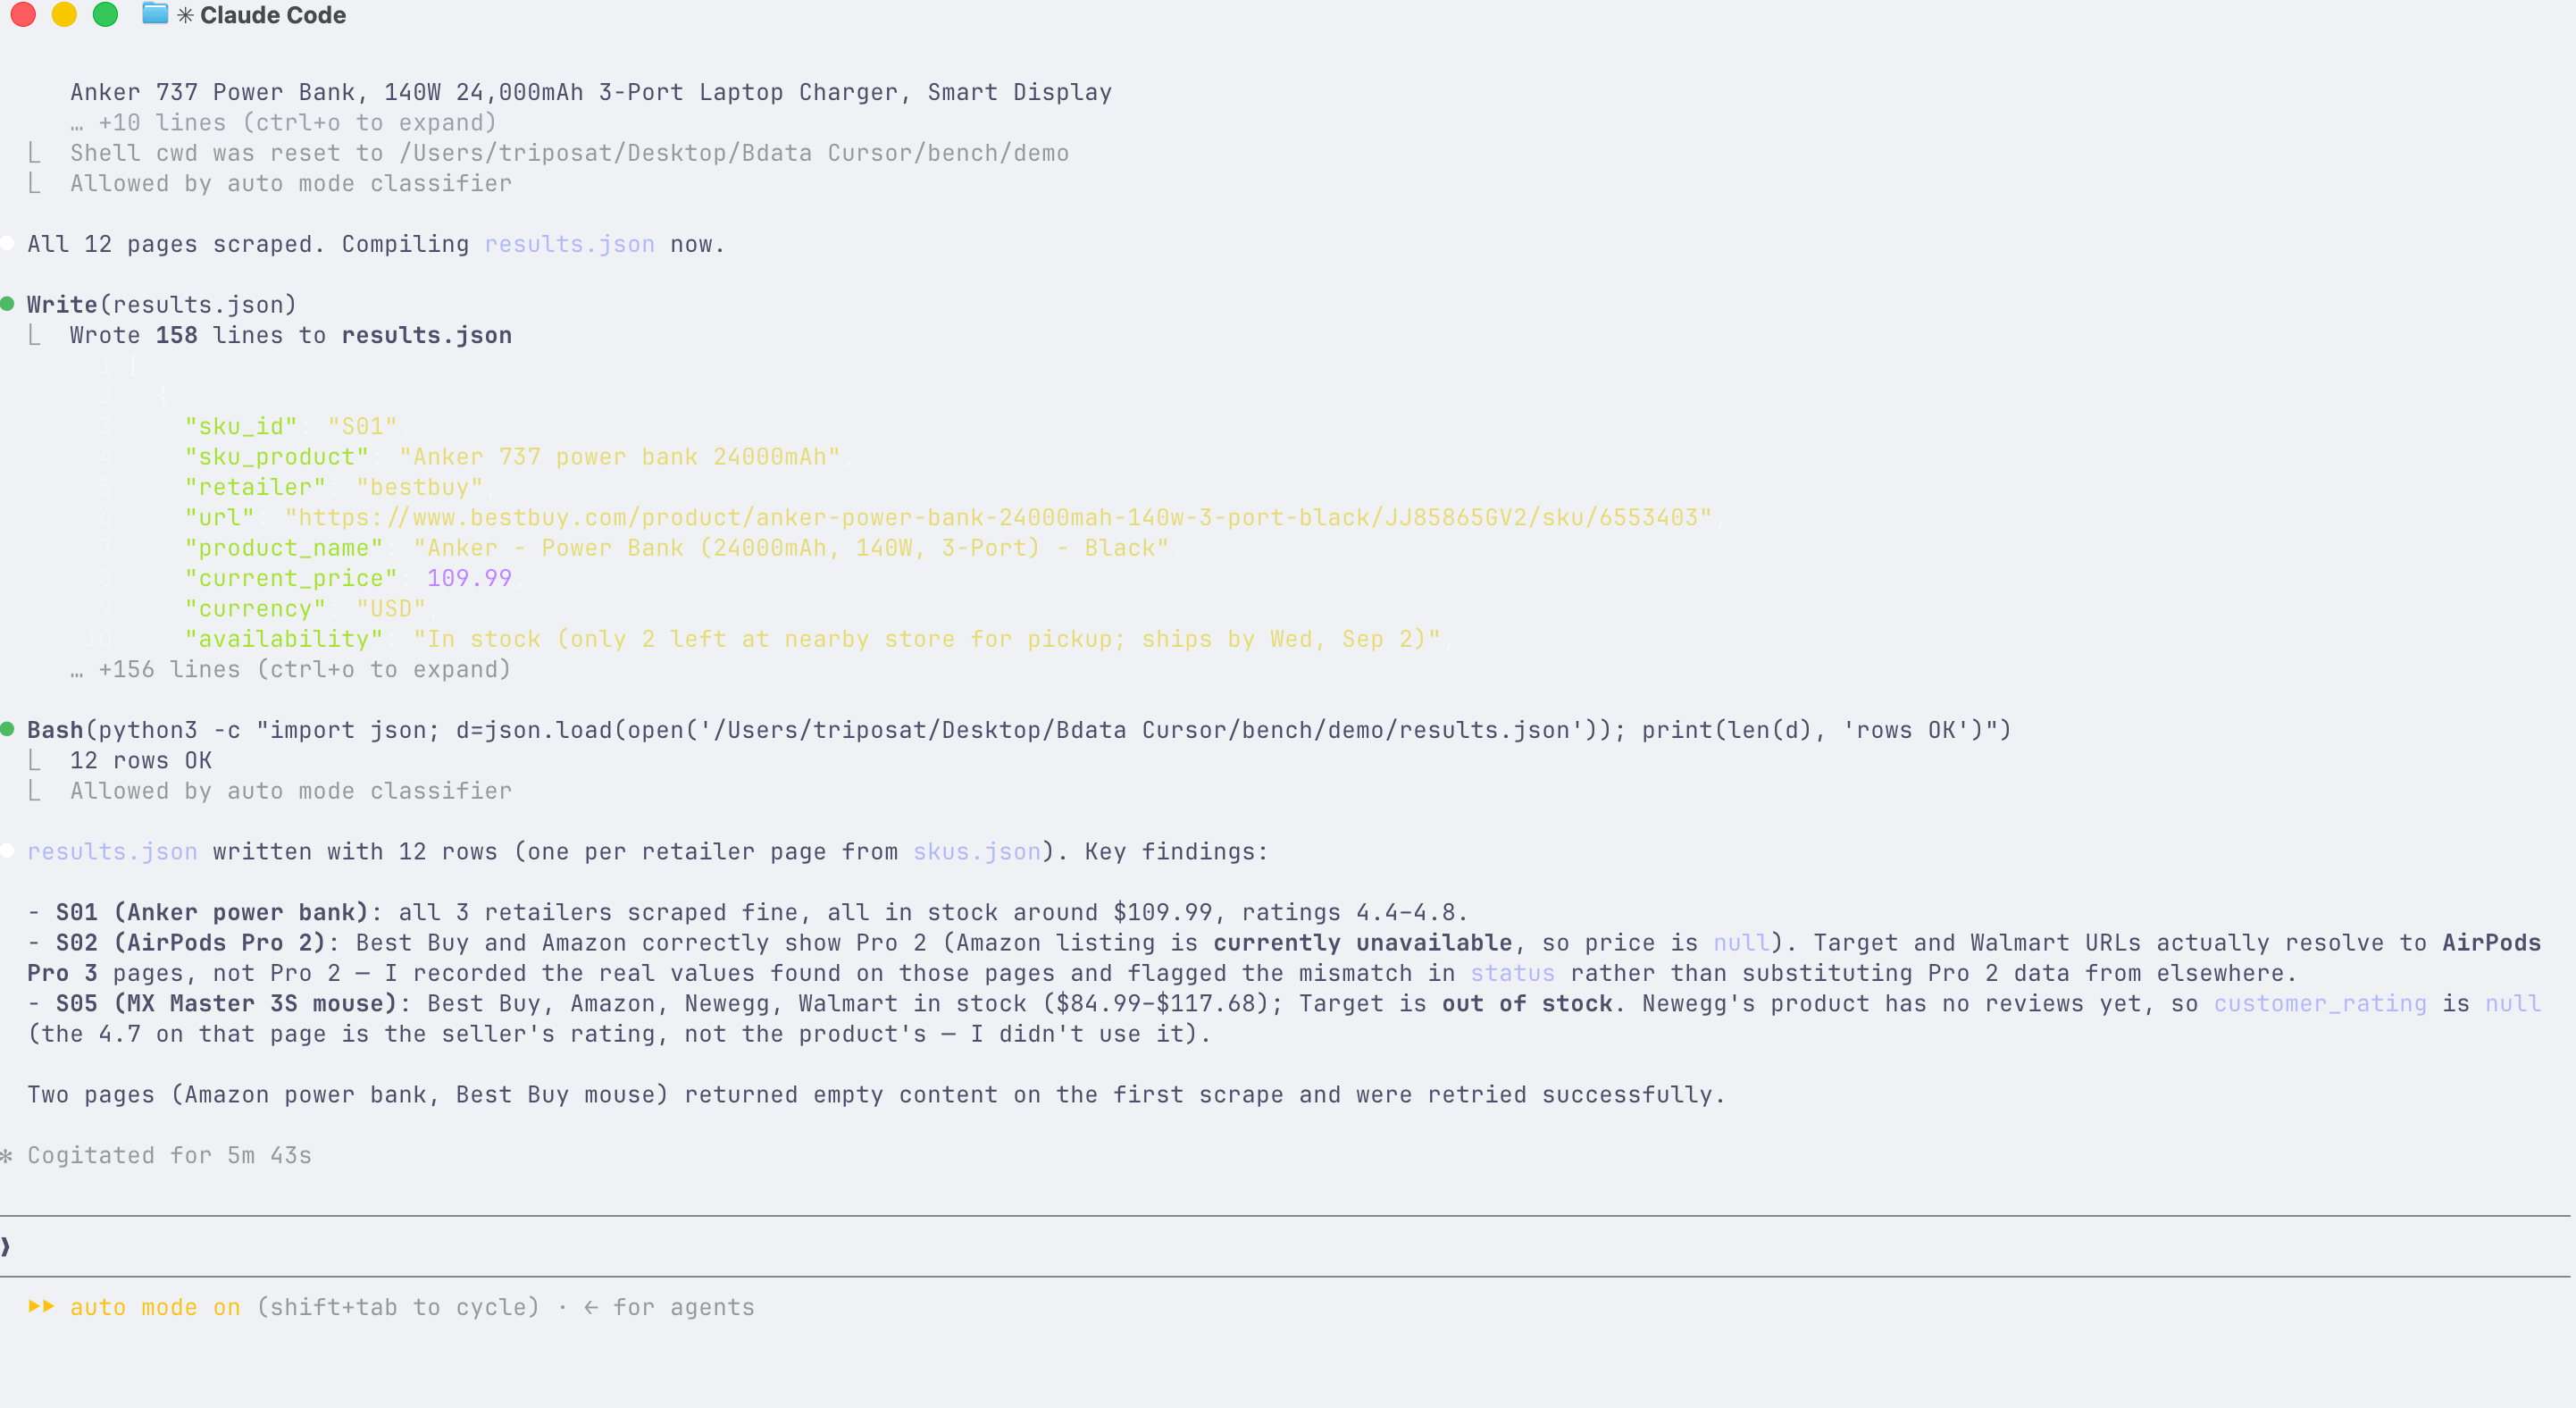
A different vendor’s agent, the same instruction, the same 3 gaps named rather than filled.
Score provenance, not completeness. It costs a few lines and it’s the check we would keep if we could keep only one.
Field accuracy against a hand-verified ground truth
Provenance says where a value came from. It doesn’t say whether the value is right. For that we read the pages.
We opened the committed payload for every one of the 41 pages and recorded the true value by eye. Where a page states its price under an explicit selling-price marker, that figure is the truth. Protection plans, comparison carousels, sponsored rows, financing instalments and struck-through “was” prices aren’t. On 4 pages the payload came back empty or partial with no resolvable buy box, and those are recorded as null with the reason rather than guessed.
That gives 100 hand-adjudicated values. Scoring price, rating and availability against them yields 97 comparisons per run. The other 3 are fields that no run attempted at all.
| Run | Correct | Accuracy | Price | Rating | Availability |
|---|---|---|---|---|---|
| A. Cursor + Bright Data | 86 / 97 | 89% | 80% | 93% | 94% |
| B+. Claude Code + Bright Data, matched effort | 85 / 97 | 88% | 86% | 93% | 85% |
| B+. Claude Code + Bright Data | 76 / 97 | 78% | 74% | 90% | 73% |
| Control. Cursor, no data layer | 72 / 97 | 74% | 66% | 93% | 67% |
| B. Claude Code, no data layer | 70 / 97 | 72% | 83% | 83% | 52% |
Reading the price column
Both arms with a data layer finish above both without. The per-field columns show where the lead comes from, and the price column needs a careful read before it means anything: A attempted a price on all 35 scoreable pages and left none blank. B attempted 31 and declined 4. On the pages it tried, B scores 94%, but a run that skips the pages it can’t read is being graded on an easier set. On a page that shows a price, a price tracker counts a blank as a miss. On that count, B still leads the column 29 values to 28, a one-value lead it bought by declining 4 pages. Price is a near-tie and neither arm should claim it.
The other two fields separate them. A reads a rating on 93% and availability on 94%. B manages 83% and 52%. On these retailers, rating and availability sit further down the page and behind client-side rendering, so a partial fetch loses them first. The data layer doesn’t read better. It gets more of the page to read.
The correction to the answer key
The price column exposed the failure mode of any benchmark that scores live pages against a fixed answer key. Our ground truth was adjudicated from payloads captured the day before the runs, and retail prices move. On 5 rows, every arm that returned a price returned the new one, and every one of them was marked wrong, so the scoreboard measured the calendar instead of the agents. Every arm that had a price agreed with the others and disagreed only with us, which sent us back to the page captures from the run window:
| Row | Answer key | What the page said |
|---|---|---|
| S02 Walmart | $199.99, 0 hits | $225.00, 9 hits |
| S09 Amazon | $138.68, 0 hits | $129.99, 14 hits |
| S02 Best Buy | $242.00, absent | $238.99, present |
| S06 Target | $18.99, absent | $19.49, present |
| S09 Target | $136.22, absent | $143.30, present |
All 5 are corrected in ground_truth_hand.json with the evidence attached. The correction raised every arm’s score rather than one, which is one sign of a real fix rather than one that flatters your own result. If you score against a stored answer key, timestamp both and re-check any row where every method agrees against you.
Effort: what each coding agent actually spends
The two CLIs report different things, so the table has gaps rather than estimates. Cursor reports tool calls, Claude Code reports turns and cost. Nothing here is inferred.
| A. Cursor + BD | Control. Cursor | B. Claude Code | B+. Claude Code + BD | |
|---|---|---|---|---|
| Wall clock | 3,281s | 3,183s | 1,054s | 1,650s |
| Distinct tool calls | 196 | 178 | n/a | n/a |
| Agent turns | n/a | n/a | 151 | 133 |
| Output tokens | not reported | not reported | 68,106 | 72,422 |
| Cache-read tokens | not reported | not reported | 12.3M | 13.3M |
| Model cost | not reported | not reported | $6.09 | $6.21 |
| Human interventions | 0 | 0 | 0 | 0 |
Cost, turns and wall clock
The table gives 3 readings.
On this workload, the data layer was close to free on the model bill. B+ cost $6.21 against B’s $6.09, a difference of 12 cents on a $6 run, for 6 more points of field accuracy. The intuition that offloading fetching to a service costs you more in tokens didn’t hold here, because the tokens you spend were dominated by what you read, not by how you got it.
B+ also finished in fewer turns, 133 against 151. In these runs, the agent with a working fetch spent its turns collecting, while the one without spent them diagnosing, retrying and writing workarounds. Turns are often the first resource to run out on a metered plan, and the data layer saved 12% of them.
Wall clock is almost identical for the Cursor pair. Run A took 3,281 seconds against the Control’s 3,183, a difference of 3% for 12 more pages and 15 more points of accuracy. The Claude Code pair moved the other way: B+ took 1,650 seconds against B’s 1,054, so the data layer didn’t save time on that agent. B was faster partly because it read 6 fewer pages; the time it saved is time it didn’t spend on the retailers it never got.
Cursor’s CLI reports no dollar figure in stream-json, so the two Cursor rows have no cost. We aren’t estimating one.
What a refresh costs
Bright Data’s Web Unlocker is $1.5 per 1,000 requests pay-as-you-go, with a free tier of 5,000 requests per month. Against that rate, one refresh of the frozen list is 41 requests, about 6 cents, and that’s arithmetic rather than an estimate. A daily refresh for a month is about 1,230 requests, a quarter of the free tier.
We aren’t publishing an account total for the benchmark. The runs shared an account with unrelated work in the same period, so a usage view for those dates wouldn’t separate them, and a number we can’t attribute isn’t worth quoting.
The coding agent cost nobody puts on a slide
Tool definitions are the context cost people quote: the profile we used costs 1,007 tokens for 5 tools, counted with tiktoken over the server’s own tools/list response, and the server exposes smaller profiles if you want less. On a workload like this one, they aren’t the cost that matters. We counted the tokens in what actually came back, using the same encoder over the 41 committed payloads.
| Tokens | |
|---|---|
| Tool definitions, once per session | 1,007 |
| The 41 pages of returned markdown | 636,311 |
| The answer those pages produced | 5,080 |
The agent read 636,311 tokens to produce 5,080. 99% of what it paid to read wasn’t the answer, and the payload came to 632 times the tool definitions it was measured against.
The load is also very uneven. Median tokens per page, by retailer:
| Retailer | Median tokens per page |
|---|---|
| Amazon | 63,920 |
| Newegg | 5,101 |
| Walmart | 2,060 |
| Best Buy | 1,789 |
| Target | 1,244 |
A single Amazon product page came back at 103,019 tokens. One page filled half a context window. An Amazon page costs 51 times what a Target page costs, so the retailers on your list matter more to your model bill than the number of them.
That also explains a number from the table above. Both Claude Code runs spent over 12M cache-read tokens. That cost came from the pages, not from the model.
What it costs at a size anyone actually runs
A 41-page run is a demonstration. A buyer asks what 100,000 pages a day costs. Taking our measured token counts and Bright Data’s published rates, at 3M requests a month:
| Per month | |
|---|---|
| Fetching, pay-as-you-go at $1.5 per 1,000 | $4,500 |
| Fetching, Scale plan at $499 plus $1.3 per 1,000 | $3,901 |
| Reading it, median page as markdown | $22,833 |
| Reading it, if your catalogue is Amazon-heavy | $575,280 |
| Reading it, as structured records | $1,115 |
We used a model input rate of $3.00 per million tokens, and the structured row is measured from the same 41 rows the agents produced. If you change those assumptions, the numbers move, which is why scripts/cost_model.py ships with the inputs at the top.
Fed to the model as markdown at mid-tier input prices, reading the data costs multiples of fetching it, roughly 6 times at our median page and far more on an Amazon-weighted list. As typed records it drops below the fetching line. On the markdown path, comparing scraping vendors on price per thousand requests measures the smaller half of the bill.
Finding listings and reading them are two different jobs
The task has a second deliverable: a search-driven feed of new listings, meaning other retailers selling the same product. Every run produced one, and this second deliverable separates cleanly from the first.
| Run | New retailer URLs found |
|---|---|
| A. Cursor + Bright Data | 46 |
| Control. Cursor, no data layer | 30 |
| B. Claude Code, no data layer | 24 |
| B+. Claude Code + Bright Data | 22 |
Every arm produced a usable feed, including both without a data layer. On the retailers we tested, search result pages weren’t gated the way product pages are, so discovery needed comparatively little help, and you should know that before you decide what to spend.
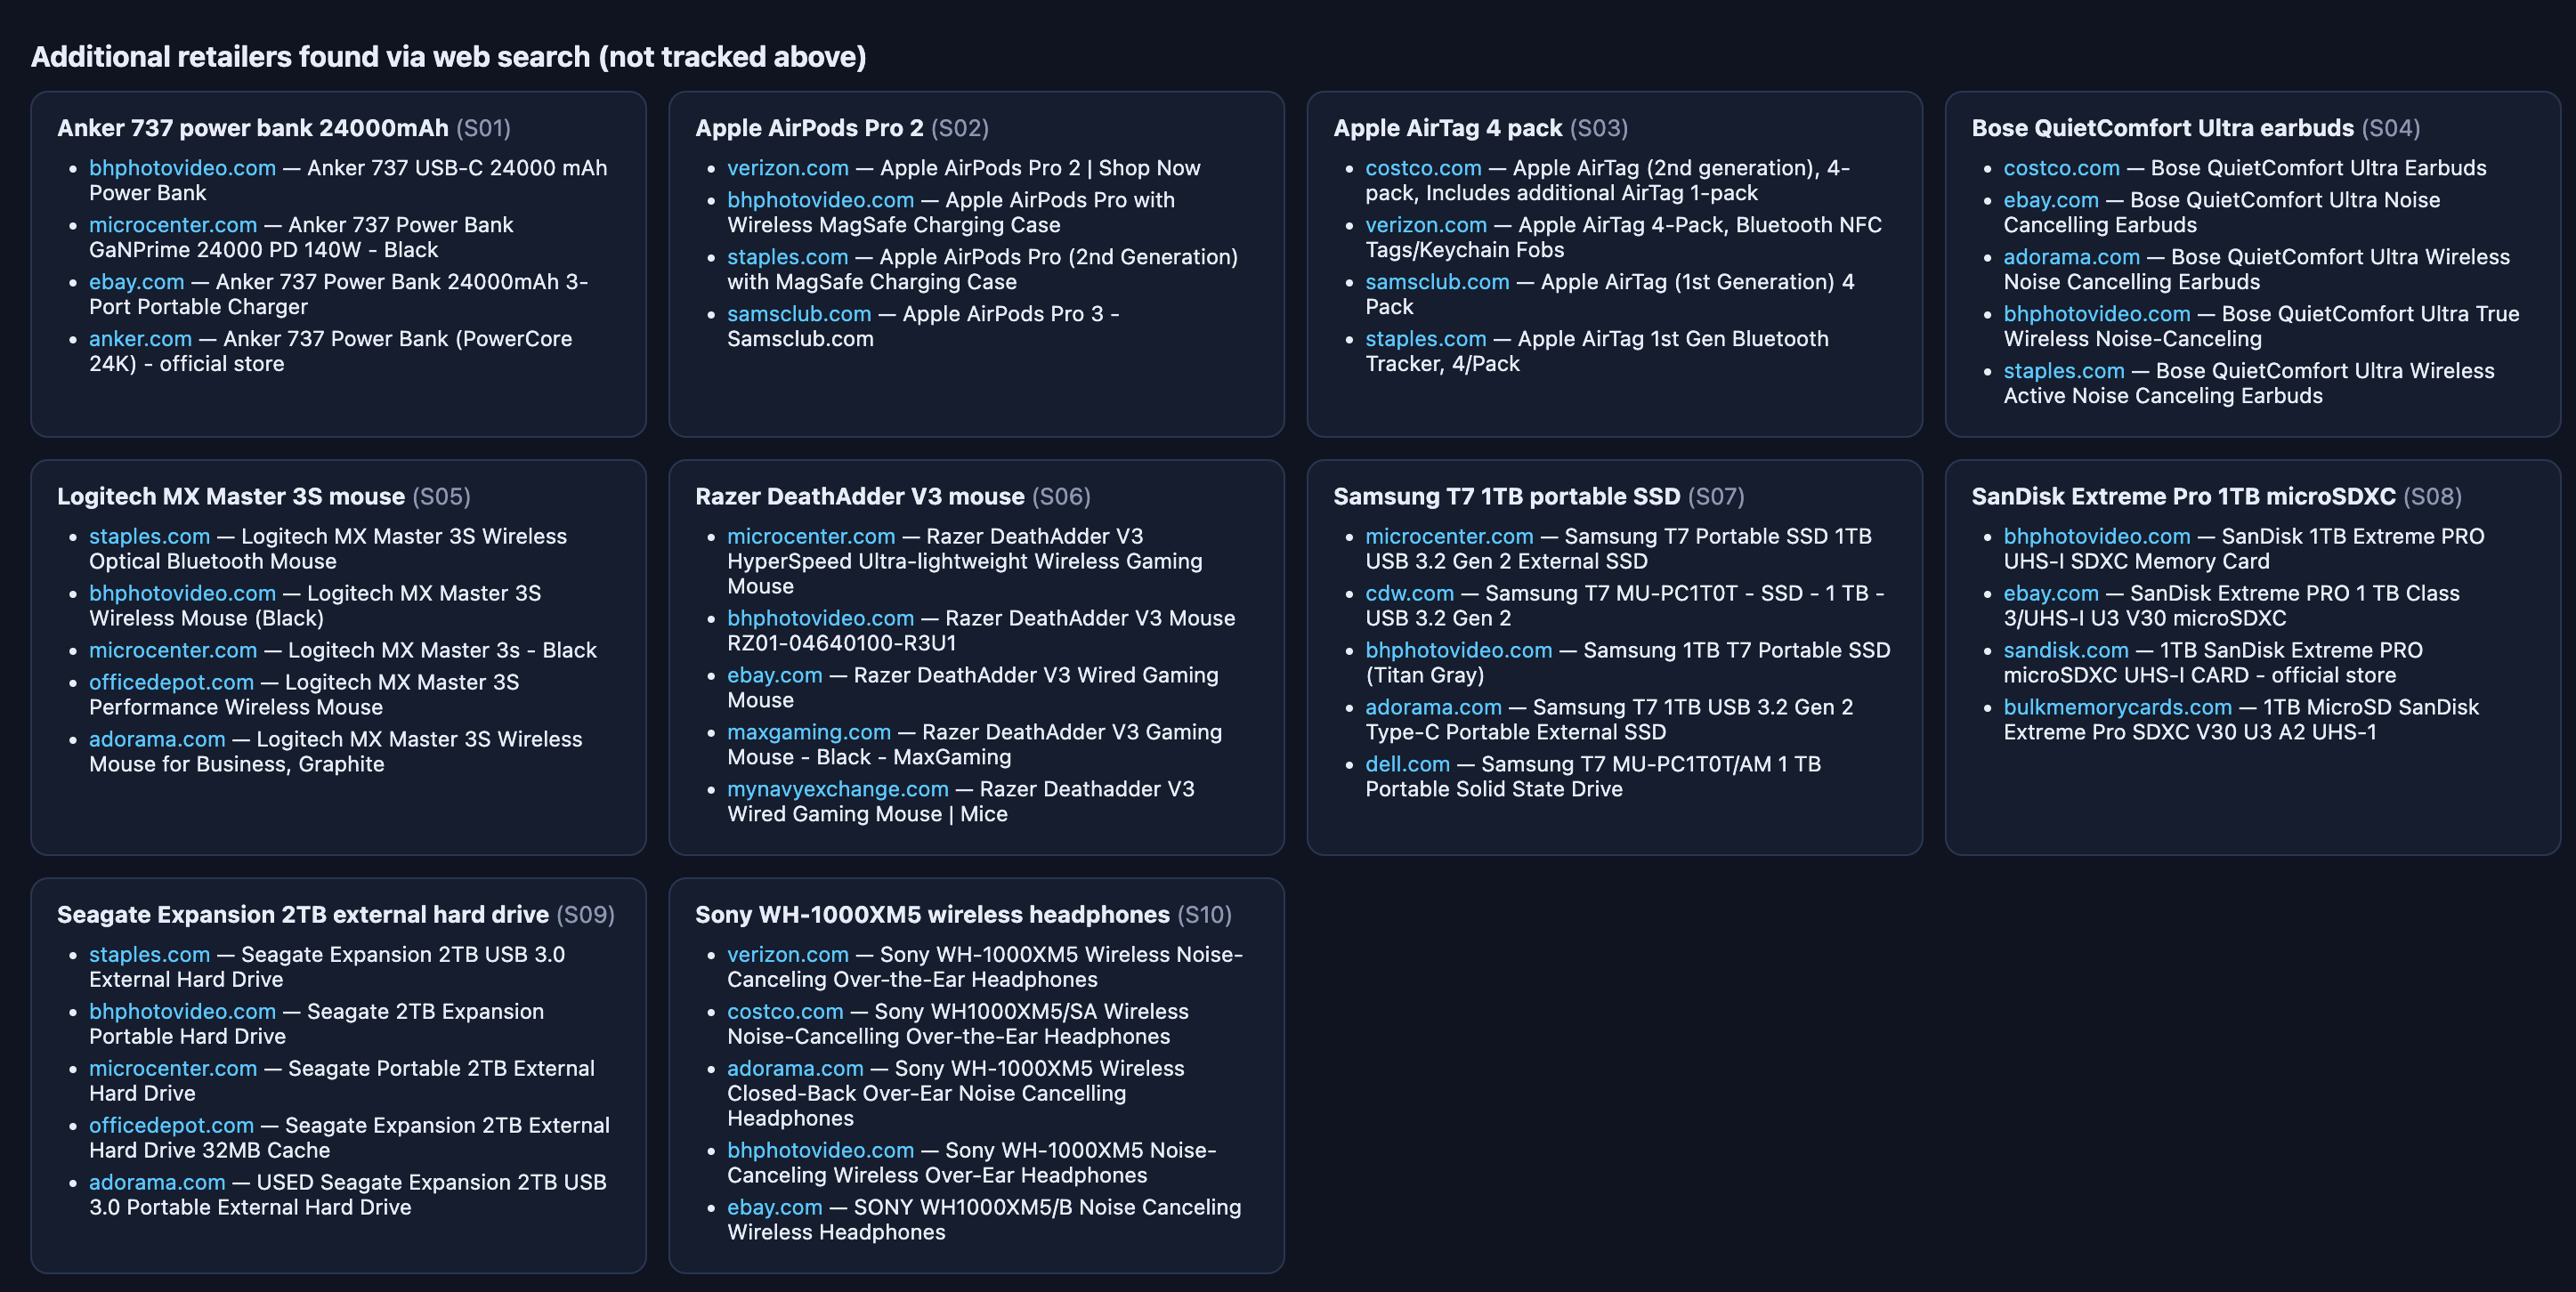
The discovery panel the agent built, from the 3-product walkthrough. The measured run’s feed is the table above.
In these runs the data layer earned its cost on the next step, where you have to open what you found. Finding a candidate and reading its price are different problems with different costs, and on these retailers only the second one was hard.
Matching the output format to the fields you need
Getting the page back and getting every field off it are different problems, and the second is a format decision.
Markdown is a reading format: clean prose for an agent, at a fraction of the tokens that raw HTML costs. Across the 41 pages it delivered all 4 fields on Amazon 10 of 10, Walmart 10 of 10 and Best Buy 6 of 9. On Target and Newegg it delivered name, price and availability but not the rating, and the markdown conversion isn’t the reason.
Those retailers rarely publish a rating as text. Newegg draws its stars as image icons, so a numeric rating appears in 0 of its 5 pages in any text form. Target has one on 2 of 7. Markdown can’t extract a number that never reaches the rendered page as text. One of the agents in this benchmark reached this conclusion unprompted and said so in its own summary: “Newegg only renders its star rating as image icons, not as text, so it’s not extractable from the page.”
When to use typed records
This is the case the structured records cover. They carry a star rating on 7 of 7 Target pages and 5 of 5 Newegg pages, because the value exists in the retailer’s data even when it never reaches the rendered page as text. Both routes use the same connection.
Pick the output format from the fields you need, not from habit. Use markdown when you want an agent to read a page cheaply. Use typed records when a specific field has to arrive as reliably as possible.
The output format is also the biggest cost difference you control at scale. At the 3M-requests-a-month volume priced earlier, reading as typed records rather than markdown costs $1,115 a month against $22,833, because a record carries the fields and not the page around them. So on these retailers typed records filled the fields markdown couldn’t reach, and they cost a twentieth as much to read.
Does it still work tomorrow?
Durability is measured over a single 24-hour window. We re-ran both Cursor trackers untouched against the same frozen list with ./rerun.sh. One window is a checkpoint, and we report it as one.
| Retailer | A, Bright Data | Control, no data layer |
|---|---|---|
| Amazon | 9 → 9 | 3 → 3 |
| Walmart | 10 → 10 | 10 → 10 |
| Target | 7 → 7 | 7 → 7 |
| Newegg | 5 → 5 | , |
| Best Buy | 9 → 4 | 8 → 0 |
| Total | 40 → 35 | 28 → 20 |
Everything held except Best Buy, in both arms. The other 4 retailers returned the same page counts they returned the day before, from code nobody touched. The single hardest target moved, and it moved for both.
What survived on the hardest retailer
The two arms differ in how much survived. The managed path kept 4 of 9 Best Buy pages; the hand-written scraper kept none, and it lost the retailer that was hardest to collect from the start. Overall retention is 88% against 71%.
Part of that movement isn’t a collection problem at all. We opened one of the dropped pages by hand, the Sony WH-1000XM5 at Best Buy. The retailer gives its own answer: “This item is no longer available in new condition.” No price, because there’s no longer a price. A tracker that returns null for that row is correct, and a tracker that fills it in from somewhere else is the failure mode described earlier. When you re-run a price tracker after a day, some of the change is in the market rather than in your code, and the two are worth separating before anyone concludes a scraper has decayed.
Read it as an early indicator rather than a settled number. A 24-hour window catches the fastest-moving defence and nothing slower, so the 4 retailers that held may simply not have changed anything yet. rerun.sh and the frozen list are in the repo if you want to run the same check against your own targets on your own schedule.
Why this gets harder from here
The measurements above describe one afternoon, and the conditions behind them are moving in 4 ways that point the same direction.
Cloudflare reported in July 2026 that more than half of internet traffic is now non-human, and that 52% of crawler requests were for AI training as of June 2026, up from 22% in spring 2025. From 15 September 2026, new domains that join Cloudflare get a default setting: it blocks bots classified as Training or Agent on pages that display ads, and it still allows Search.
Detection is moving below the page. Akamai published research in August 2026 finding that 63.2% of agentic browser-agent requests contained zero mouse events, and that only 1.0% carried enough movement to be scored by their conventional behavioral models at all. The agents in that study were commercial browsing agents rather than scrapers.
Some of the work pushes the other way, toward proving identity rather than hiding it. Web Bot Auth, drafted by authors at Cloudflare and Google, was at draft-meunier-webbotauth-httpsig-protocol-02 on 18 August 2026, and it lets an agent sign requests with a published key. It’s an individual Internet-Draft rather than an adopted standard, and Cloudflare validates Ed25519 only.
The fourth is a detail from a court record rather than a ruling to reason from. In Amazon.com Services, LLC v. Perplexity AI, Inc., decided on 4 August 2026, the dispute centred on an agent that didn’t send a user-agent string identifying it as an AI agent. How your traffic identifies itself is becoming a question with consequences.
All 4 bear on the same variable. None of them changes what a coding agent can write, and each of them bears on how its requests are treated.
Next steps
The bug a developer finds weeks later, the pricing decision already made on bad data, the number an AI product repeats with total confidence: all 3 can start from one value that arrived with no way to tell where it came from. The steps below help separate that value from a real one.
Freeze your target list before you measure anything, so a change in the number means a change in the world rather than a change in your sample.
Score on provenance, not completeness. Record, per field, whether the value came from the page you were tracking. That single column separated a run that looked perfect from runs that were honestly incomplete, and no other metric we collected caught it.
Score a fetch on whether the fields came out, never on the status code, and treat an empty payload as a failure in your own code, whichever layer produced it. When you attach a managed layer, know whether you’re calling a hosted endpoint or running a server yourself, because the two paths can route through different networks, and your account’s IP settings may apply to only one of them.
Then measure your own targets. Ours were 5 US retailers on one afternoon, from an Indian connection and a US residential exit, and the per-retailer numbers show how little the aggregate says about any single site.
What is in the repo
The task spec, the exact prompt, the frozen SKU list, all 4 transcripts, the raw per-page results, and the scoring code are published in the companion repo, so you can run the same thing against your own list.
One file in there deserves a mention. verify.py re-derives 40 published figures from the committed data and checks that the draft still says them, exiting non-zero if any of those 40 has drifted. No network and no credentials. If you run it bare, it prints the figures straight from the data. If you give it an article file, it checks the two against each other:
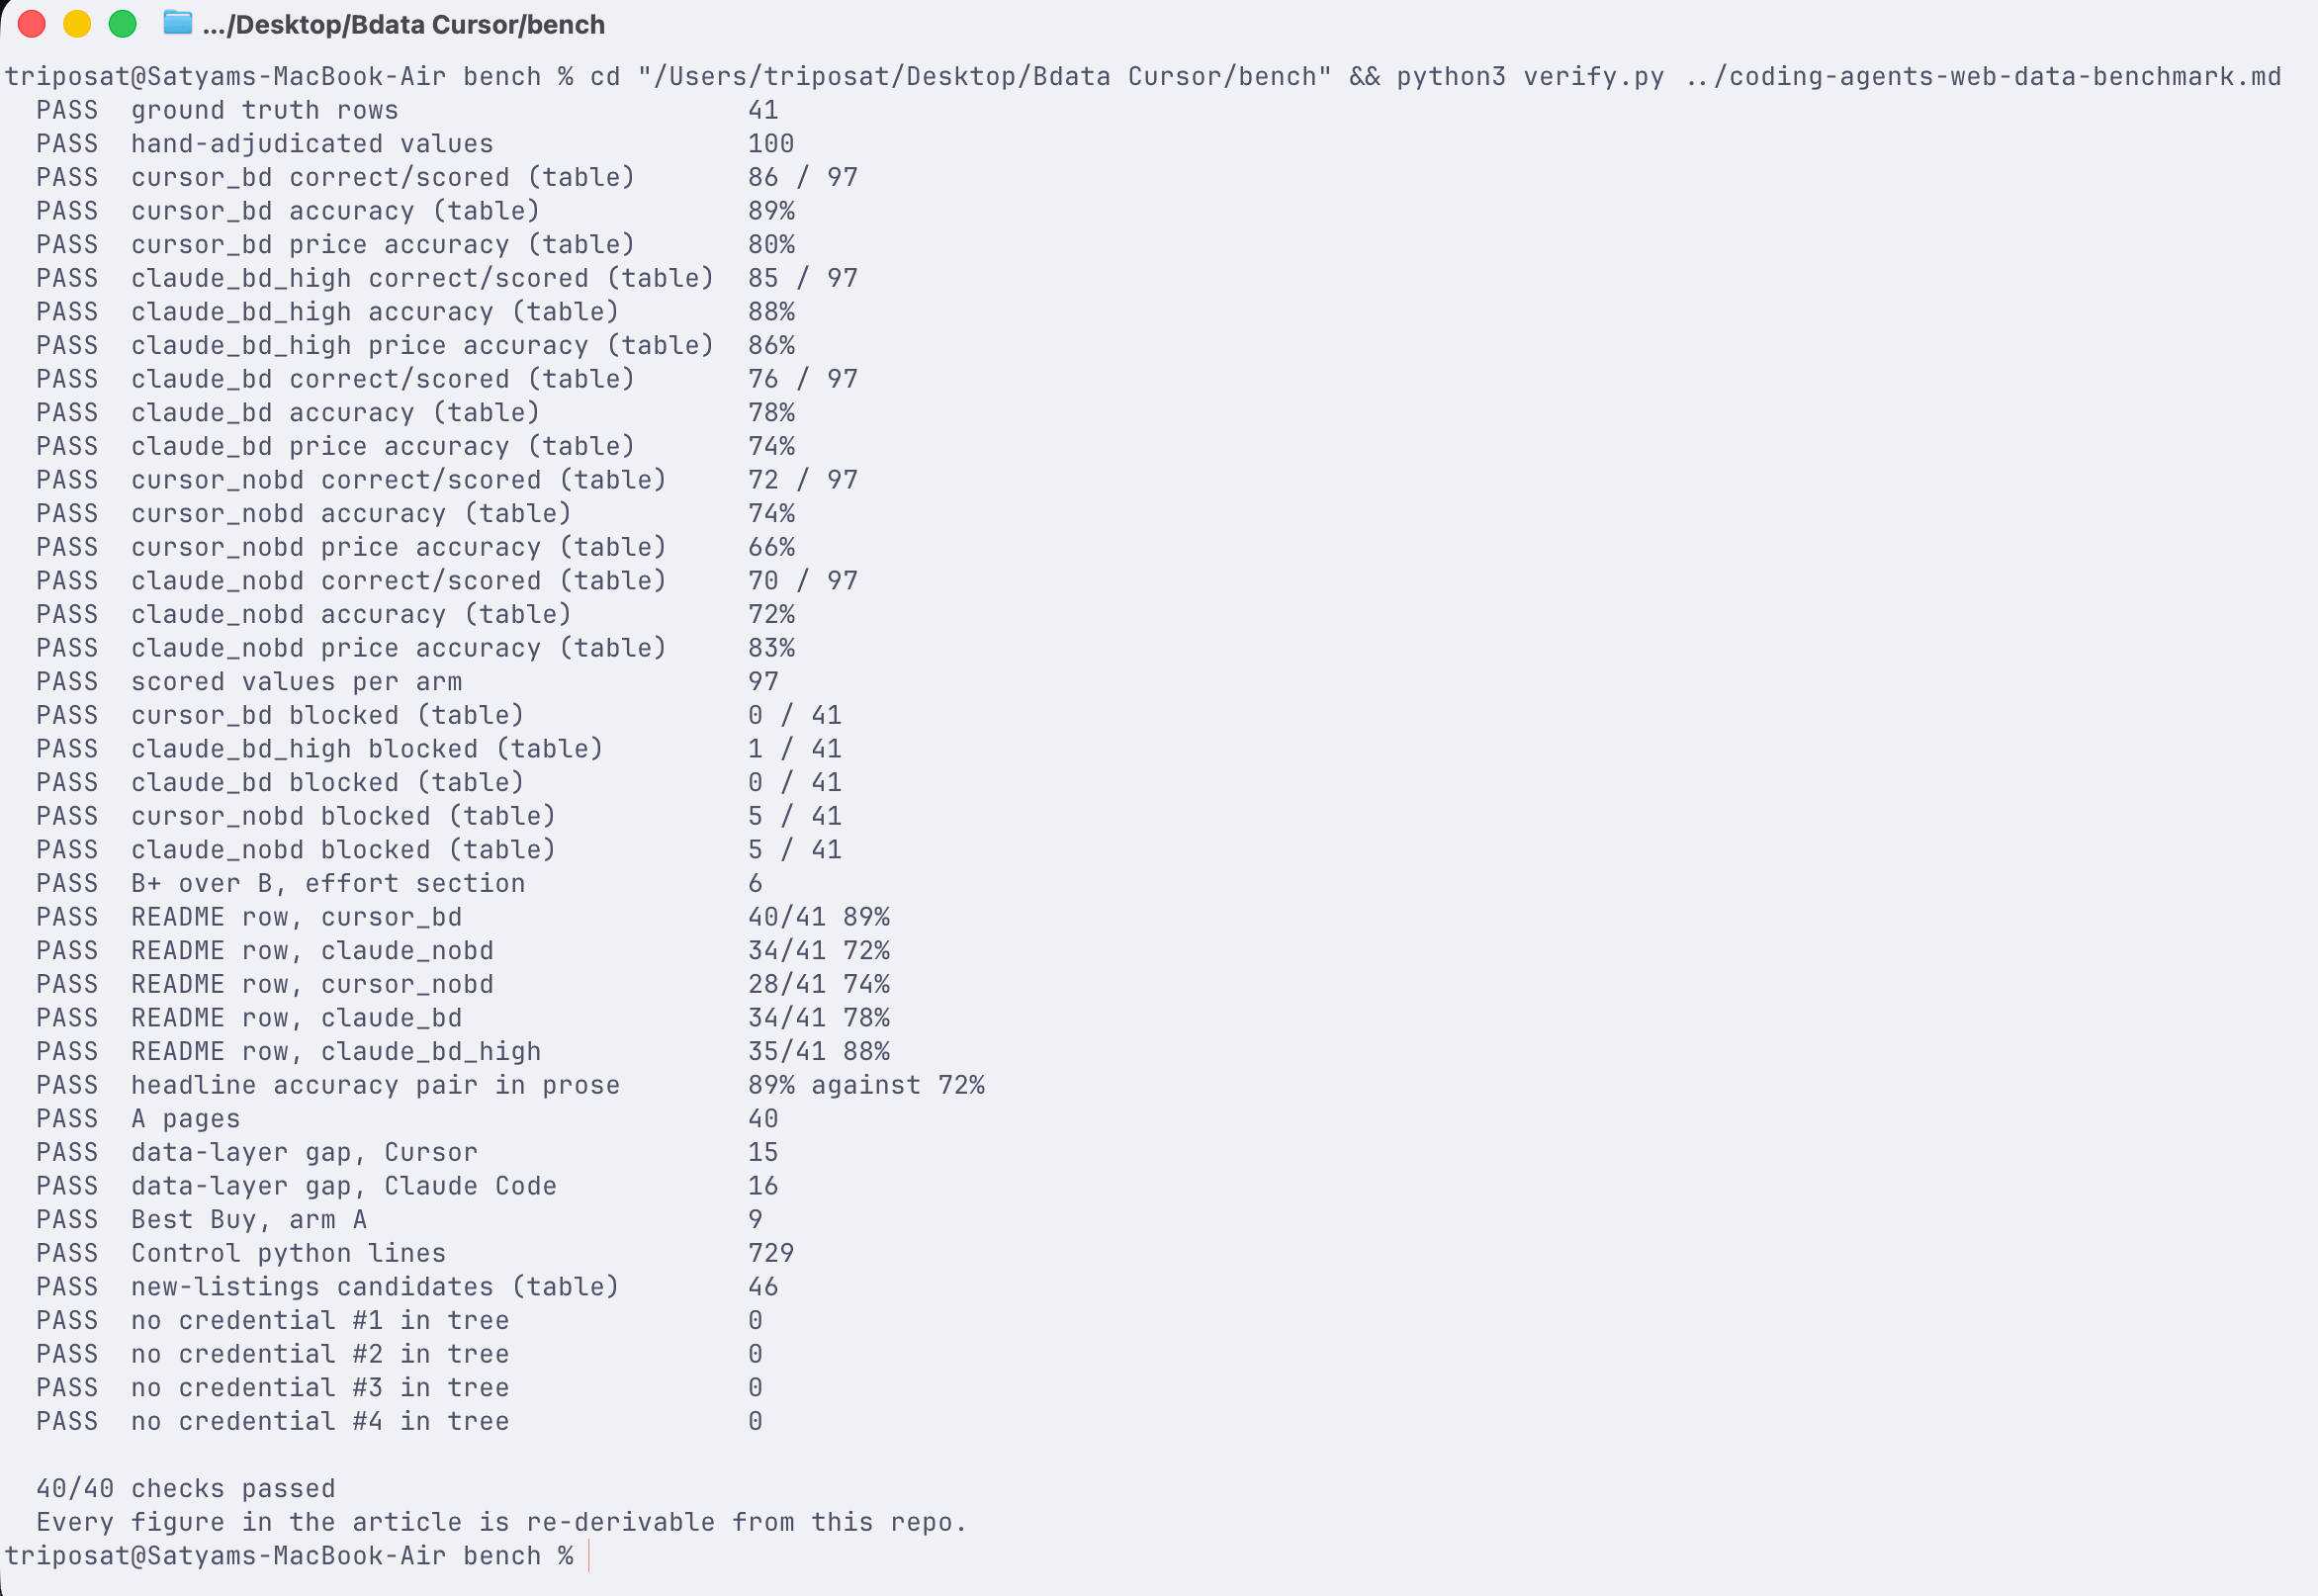
One command, no credentials. It parses the tables and compares specific cells, so a wrong number fails even when the same number appears correctly elsewhere.
The figures above also ship as data. claims.json lists 39 of them with the file each was derived from and the script that computed it:
{ "id": "cursor_bd.field_accuracy", "value": 89, "unit": "percent",
  "derived_from": "runs_isolated/cursor_bd/results.json",
  "computed_by": "scripts/score_accuracy_iso.py" }
So don’t take our word for any of it. Point your own coding agent at the repo and ask it to check this page against the data. That’s a fair test of a benchmark, and it’s the same task the benchmark itself measures.
Bright Data’s free tier includes 5,000 Web Unlocker requests per month, and one refresh of a 41-page list costs 41 of them. Point the hosted Bright Data MCP server at your own targets and see whether any of this holds for you.
Frequently asked questions
Do AI coding agents need proxies or an unblocking service to scrape?
Yes for the hard targets, and the measured gap is wide: with a data layer the same class of agent read 40 of 41 pages at 89% field accuracy, against 34 pages and 72% without one. It also did that without writing a line of fetching code. Difficulty isn’t spread evenly, though. A current model driving its own browser handled the easier retailers in our list unaided, reading Walmart 10 of 10 and Target 7 of 7. In our runs it didn’t get the last stretch, and that stretch is where the failures and most of the retry turns concentrated. So do not ask whether you need an unblocking layer, but which of your targets need one and what your engineering time is worth.
How can I tell if scraped data is accurate?
Check where each value came from, not whether the row is full, then spot-check a sample against the page by hand. In this benchmark, none of the 4 runs back-filled anything. An earlier Claude Code run with no data layer, on an older model, reported a flawless 41 of 41 in which 29 ratings equalled a hardcoded product-level value from a patch script it wrote itself. Both shapes exist, a completeness score can’t tell them apart, and the check costs a few lines.
What success rate should I expect from a web scraping API?
Treat any quoted success rate as a measurement rather than a guarantee. The 40 of 41 in this benchmark is one observation, on 41 pages, on one day, with the model pinned to claude-sonnet-5, from one network location. The same arm re-run 24 hours later didn’t return an identical number, which is normal for live pages and worth expecting. Your own number will depend on your target list, so measure it against that.
How much does Bright Data cost for web scraping?
Web Unlocker is $1.5 per 1,000 requests pay-as-you-go, with 5,000 requests a month on the free tier. A single 41-page refresh is 41 requests, about 6 cents, so a daily refresh of this list runs well inside the free tier. We aren’t quoting a total for the whole benchmark: it shared an account with unrelated work, so that number wouldn’t be attributable. The Scraping Browser pass behind the ground truth is a separate product on a separate unit.


Technical Writer
 5 years experience
Satyam Tripathi helps SaaS and data startups turn complex tech into actionable content, boosting developer adoption and user understanding.